In this section: How to: Reference: |
You can activate traces at server startup or while the server is running. Information Builders recommends starting the server with traces active so that a full set of traces can be sent to Customer Support Services to help diagnose issues that arise. If you need to contact Customer Support Services for assistance, you can use a facility called savediag to expedite the transmission of server information. For details about using savediag, see Gathering Diagnostic Information for Customer Support Services. Refer to the Installation manual for your platform for more information on starting the server with traces active.
To activate traces for a running server, a server administrator can quickly enable or disable traces at any point in a work process by clicking Workspace, Enable (or Disable) Traces from the Web Console menu bar.
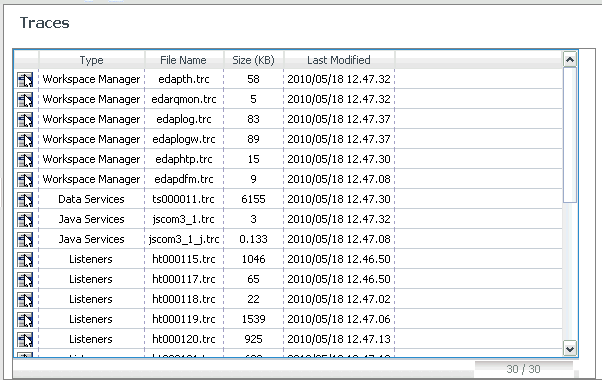
The server administrator can use the Web Console to initiate and control a wide range of traces, and dynamically turn traces on or off for a running server. To see a list of traces, select Workspace from the menu bar. Open the Logs and Traces folder on the navigation pane, right-click Traces, and select View.
The Web Console displays the following list of traces: Workspace Manager, Data Services, Java Services, Special Services, Listeners. (The traces that are active varies depending on the types of requests that have been made against the server.)
Right-clicking a trace displays the follow options:
Note that the selected trace file is displayed with any active filtering applied.
Once traces have been configured and turned on by a server administrator, they can be viewed by application administrators and server operators.
To access the last agent trace:
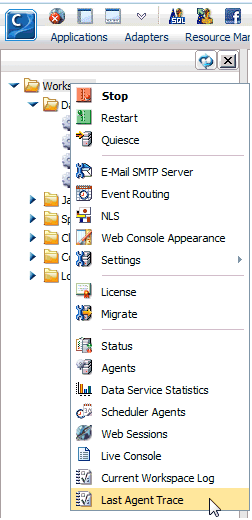
The last agent trace opens.
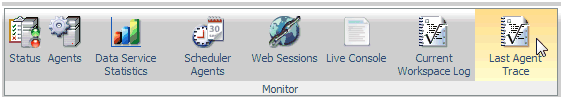
You can also access the last agent trace by selecting Last Agent Trace from the Monitor section of the ribbon, as shown in the following image.
If you want to turn dynamic traces on or off for one user, you can include the command SET TRACEUSER={ON|OFF} in a user profile or in an individual procedure.
You can also use the SET TRACEUSER=tracename command turn dynamic traces on and send the trace to a named file. The file must specify a .trc extension and use a full path name for server traces so the traces are retained after server execution.
How to: Reference: |
You can configure traces to limit their size and select the components to activate.
The Traces Configuration page opens.
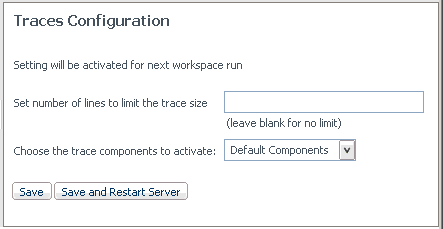
A blank entry indicates no trace size limit.
Note that Customer Support Services may request that you change from the default trace setting to a custom setting to facilitate their research.
Default Components
All Components
Typical Components
Custom Components
This option allows you to select the specific components to activate.
The components are categorized as follows (each category has a list of trace options within it):
Tip: If you wish to restore default settings or choose typical settings, select these options, then click Save Settings. The selected group will be checked when you reopen the Custom Components list.
You can use set the size limit of the trace files. The trace size limit specifies the maximum number of lines in the trace files. The value is written into the IBITRACE.FEX file as SET TRACESIZE = value and requires a server restart to activate. After the size limit is reached for a particular trace, the trace data is redirected to an alternate file with an extension of .TRB. When the size limit is reached in the .TRB version of the file, then writing resumes with the .TRC version of the file.
A trace cycles between the two matched sets of files to alleviate maxing out a disk drive with large individual traces. Each cycle starts a fresh file (versus an append). If there are intermediate traces that need to be saved, it is up to the site to monitor and implement specific methods to save traces based on their needs and capabilities. For example, copying to an archive disk or secondary machine and possibly using compression.
The SET TRACESIZE=# setting must be used in conjunction with a SET TRACEON= value. If the IBITRACE.FEX file is changed or created using an editor, ensure that there is also a SET TRACEON=value setting. The existence of the IBITRACE.FEX file only sets what is traced when tracing is active, but does not control if tracing itself is active.
Displaying microseconds may be useful if trying to match very precise event times between traces or study the performance of specific events when multiple events occur within a given second on a normal trace.
The setting syntax is SET TRACESTAMP=TLEFT and may be used in a focexec to activate in a specific trace or in the IBITRACE.FEX file to activate at server start.
There is no Web Console feature on the Trace Configure page to activate TRACESTAMP in IBITRACE.FEX, but the line can be added by opening the Configuration Files folder in the Web Console and using the edit against the Trace Profile object.
The SET TRACESTAMP=TLEFT setting must be used in conjunction with a SET TRACEON= value. Always ensure that there is also a SET TRACEON=value setting in the IBITRACE.FEX file when editing. The existence of the IBITRACE.FEX file only sets what is traced when tracing is active, but does not control if tracing itself is active. The SET TRACESTAMP=TLEFT feature also negates the ability to properly use Web Console Trace Filtering for specific events, do not using filtering with this feature active.
How to: |
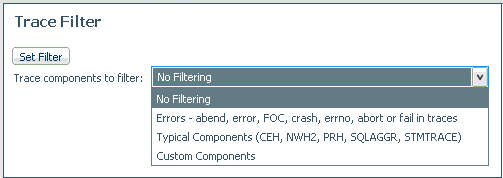
Filter allows you to limit the types of errors or components that are included in the traces.
The Traces Filter page opens.
Capturing traces in a script file enables you to isolate server problems. Specifically, you can enable this type of custom trace, then reproduce the problem and capture the input commands issued from a front-end tool (such as WebFOCUS Developer Studio) to the server. Customer Support Services can then isolate debugging for the server only, instead of having to recreate a whole complex environment.
The trace setting will be active the next time the server is started.
In this section: How to: |
The Session Log records the activity that takes place between the current Web Console session and the server. For example, when a procedure or DataMigrator job is run, the Session Log records the WebFOCUS code and SQL statements that are sent from the console to the server for execution on the server.
The log also records the response that the server returns, in addition to the answer set, such as error messages and informational messages.
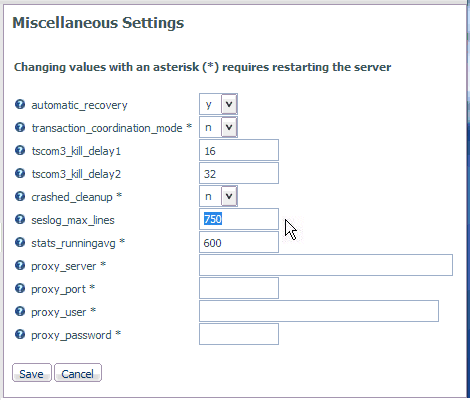
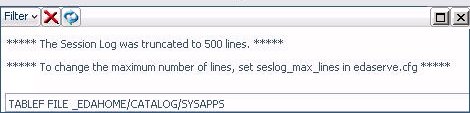
By default, the Session Log holds 500 lines. You can increase or decrease the number of lines.
In the following image, the value for seslog_max_lines is set to 750.
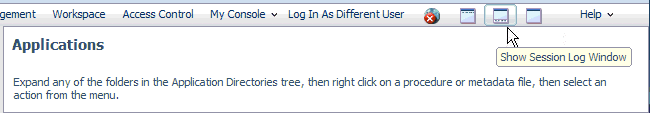
Tip: After you open the Session Log, the Show Session Log Window icon disappears from the menu bar. When you hide the Session Log, as described in step 6, the icon reappears.
A small pane opens near the bottom of the window, similar to the one shown in the following image.
 button on
the left of the Session Log menu bar to display the current contents
of the log.
button on
the left of the Session Log menu bar to display the current contents
of the log.
In the following image, the check boxes for Focus, Messages, and Timestamp are selected to include the display of WebFOCUS commands and messages, and to include the date and time of each entry in the log.
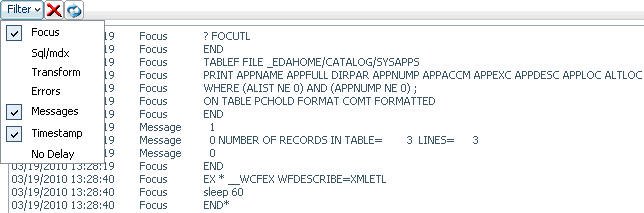
When you filter the Session Log, its contents automatically refresh to reflect the last criterion that you specified.
 button
on the left of the Session Log menu bar to update the log.
button
on the left of the Session Log menu bar to update the log.Ctrl+A, Ctrl+C, and Ctrl+V to select all the contents of the log, copy it, and paste it into another file.
Ctrl-click to highlight a line.
Shift at the beginning of a block of lines, and Shift-click at the end of the block of lines, to highlight the lines.
 on
the right of the Session Log menu bar.
on
the right of the Session Log menu bar.
You can display a log of the activity that takes place in an individual Web Session.
The Performance Report for all Web Sessions is displayed.
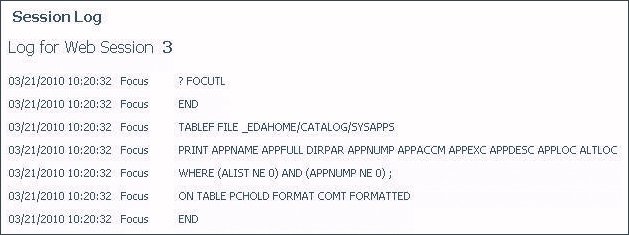
The log for the selected Web Session opens, as shown in the following image.
| iWay Software |