DataMigrator Log, Statistics, and Summary Flow Reports

How to:

Reference:

The DataMigrator logs and traces folder contains a link that opens the Logs and Traces dialog box. This provides access to viewing two reports:

Note:


Top of page

x
Procedure: How to Run a Log Report

The Log report displays the messages generated by the flows that have been run from the DMC.

  1. In the navigation pane, expand the Workspace folder, followed by the Logs and Traces folder, as shown in the following image.

    Logs and Traces Folder

  2. Double-click DataMigrator Log and Statistics or right-click it and select View.

    The Log and Statistics window opens, as shown in the following image.
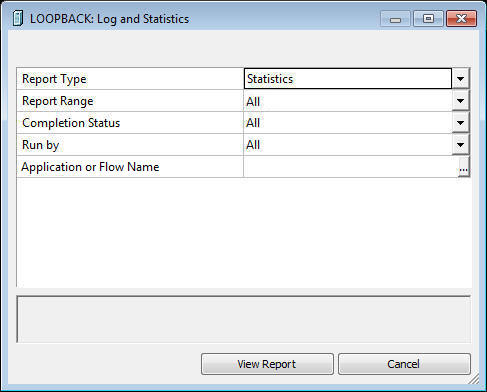
    Log and statistics window

  3. Select Log from the Report Type drop-down menu.
  4. From the Report Range drop-down menu, select Last, All, or Specify Time.
  5. Optionally, specify a Flow Name.
  6. Click View Report.

The report opens in the workspace, as shown in the following image.

Log Report

Note: For process flows, you can drill down to details of the flow components by double-clicking the blue Job ID line.


Top of page

x
Reference: Log Report Columns

Log reports provide the information listed and described in the following table:

Column

Format

Function

Datetime

Alpha 20

Date and time of log entry.

Message Code

Alpha 9

Message code number.

Log Messages

Alpha 80

Message strings in the log.

Application

Alpha 64

Flow application directory.

Name

Alpha 64

Flow name.

Job ID

Alpha 23

Unique internal job name.


x
Procedure: How to Run a Statistics Report

The Statistics report provides information about the flows that have been scheduled or submitted from the DMC. The Statistics report also provides access to the message log of each flow.

  1. In the navigation pane, expand the Workspace folder, followed by the Logs and Traces folder.
  2. Double-click DataMigrator Log and Statistics or right-click it and select View.

    The Log and Statistics window opens.

  3. Select Statistics from the Report Type drop-down menu.
  4. From the Report Range drop-down menu, select Last, All, or Specify Time.
  5. From the Completion Status drop-down menu select All, Completed, Completed Successfully, or Completed with Errors.
  6. Optionally, specify a Flow Name.
  7. Click View Reports.

The report opens in the workspace.

To view the message log for an individual flow, double-click its Link to log. Failed flows will be shown in red, as shown in the following image.

Failed logs

The Statistics report includes the following for each flow:


Top of page

x
Reference: Statistics Report Columns

Statistics reports provide the information listed and described in the following table:

Column

Format

Function

User ID

Alpha 32

User ID which executed a request.

Application

Alpha 64

Flow application directory

Name

Alpha 64

Flow name.

Log

Alpha

Job ID as a link to the flow log.

Parent Log

Alpha 23

Log for parent flow.

Start Datetime

Alpha 20

Start date and time of execution.

End Datetime

Alpha 20

End date and time of execution.

Total Runtime

Alpha 20

Total run time for the flow.

Return Code

Alpha 16

Internal return code for the flow.

Original Request

Alpha 32

Original flow where dependency started.

Original User

Alpha 32

Original user ID running dependent flow.

Dependency Count

Integer

Dependency number.

Message

Alpha 80

Text explanation of error messages.

CPU Time

Alpha 15

Total CPU time in milliseconds.

Target Name

Alpha 64

Target name.

Note: This and the remaining columns apply on a per target basis.

Transactions

Alpha 15

Number of rows processed.

Accepts

Alpha 15

Number of rows accepted.

Nomatch

Alpha 15

Number of rows rejected.

DBMS Errors

Alpha 15

Number of rows rejected by the database for a constraint violation, such as a Unique Index constraint, a Not Null constraint, or a user-specified constraint. For a file target, the number of rows rejected due to format conversion errors.

Format

Alpha 15

Number of format rejections.

Invalid

Alpha 15

Number of rows rejected for failing validation tests.

Duplicate

Alpha 15

Number of rejected duplicate records.

Input

Alpha 15

Number of rows input.

Changed

Alpha 15

Number of rows updated.

Deleted

Alpha 15

Number of rows deleted.


x
Reference: Log and Statistics Window

The Log and Statistics window shown in the following image is available from the navigation pane Logs and Traces folder by double-clicking the DataMigrator Log and Statistics, or by right-clicking it and selecting View.

Log and Statistics window

The Log and Statistics window has the following fields and options:

Report Type

Enables you to generate either a log or statistics report by selecting either option from the Report Type drop-down menu.

Report Range

Allows you to select what time range you want to run the report for. The options are Last, All, or Specify Time. If Specify Time is selected, an area opens where you can specify the start and end date and time. If Statistics is selected, the default value is All. If Log is selected, the default value is Last.

Completion Status

Allows you to view all reports, completed reports, completed successfully reports, or reports completed with errors. This option is only available when running a Statistics report.

Run by

Allows you to view reports for all flows and those initiated by the scheduler or submit. This includes flows initiated from the DMC, WC, and CMRUN.

Flow Name

Allows you to specify a specific flow or procedure to run the report on.


Top of page

x
Reference: Statistics Window

If you select the Statistics Report Type and All as the Report Range in the Log and Statistics window, you will get a report as shown in the following image.

Statistics Report

To view the log report, double-click a log in the Log column or right-click a log and select Show Log. If the log has output, right-click the log and select Output.

You can view a different log report by closing the one that is open and selecting a different log report hot link from the Statistics report.

To delete a log and its output, select its corresponding check box and on the Report tab, in the Tools group, click Delete Selected.


Top of page

x
Procedure: How to Run a Summary Flow Report

A Summary Flow Report displays all of the flows on the server or in a specific application directory.

  1. In the navigation pane, right-click Application Directories or a specific application directory folder and select Impact Analysis, then Flow Report, then Summary, as shown in the following image:

    Summary Menu

  2. Selecting to view the report from Application Directories includes all the flows. If you selected a specific application directory, the flows in that particular application directory are displayed.

The report opens in the workspace, as shown in the following image.

Summary Flow Report


iWay Software