Choosing an Output Format

In this section:

How to:

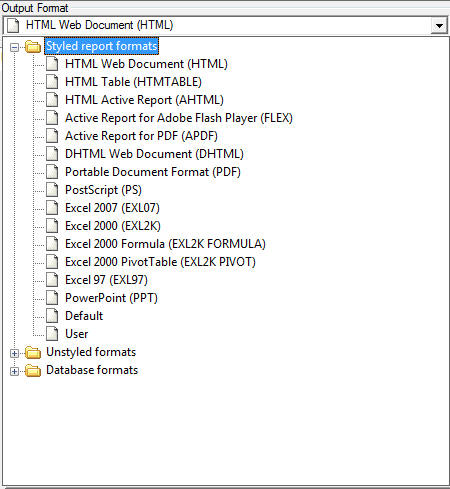
Before running a report from Report Painter, you can quickly switch the output format in which it will appear. The Report Options dialog box is driven by the selected output format. This enables you to easily distinguish between various options specific to each output format. Formats are grouped into the following categories: Styled report formats, Unstyled formats, and Database formats.

If you are opening a report that was created using the Document Composer tool, the output format cannot be changed.

The Styled report formats are shown in the following image.

The Unstyled formats are shown in the following image.

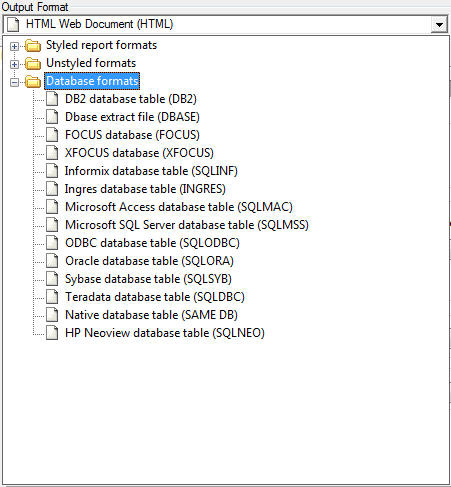
The Database formats are shown in the following image.

The Report Options Output tab, Features tab, and Format tab are available to set different styling attributes. The Style, Drill Down, Computes, View, and Images tabs are also available.

Depending on the output format you select, different tabs appear as follows:

Note:

The format you choose in Report Painter applies only to the current execution of the report. (If you wish to change the default display format for all subsequent reports created in Report Painter, select Options from the Windows menu, and specify a report format from the Reporting tab.)


Top of page

x
Procedure: How to Select the Report Output Format
  1. In Report Painter, select Output from the Report menu. The Report Options dialog box opens.
  2. From the Select Format drop-down list, choose the output format for the report.

    The top level of the Report Options dialog box shows the selected format and determines what tabs and options appear in the lower part of the dialog box.


Top of page

x
Procedure: How to Select the Report Output Format From the Output Format Toolbar
  1. Click the drop-down list on the Output Format toolbar.
  2. Choose an output format for the report.

Tip: If you wish to change the default display format beyond a single report execution, select Options from the Windows menu in the Explorer, and choose a different report format from the Reporting tab.


Top of page

x
Procedure: How to Edit the User Format From the Report Options Dialog Box
  1. In Report Painter, select Output from the Report menu. The Report Options dialog box opens.
  2. From the Select Format drop-down list, choose User as the selected output format for the report. The Edit User Format button appears.

    Note: You may also select multiple style sheet blocks when User is selected as the output format. The active style block (HTML, EXCEL, PDF, AHTML, FLEX, APDF, PPT) present a subtab on the Report Options dialog box with corresponding report options available for that style block. For more information about selecting style blocks, see Generating Format-Specific Style Blocks.

  3. Click the Edit User Format button. The Variable Editor opens, which enables you to assign a variable as the display value and select the output format of a report.

  4. The Accept List shows a list of available report output formats to choose from. You can add or delete display values.
  5. When you run the report, the WebFOCUS Auto Prompting Facility screen opens instructing you to select a parameter. Select a display output and run the report.

Top of page

x
Formatting Your Report With the Report Options Dialog Box

How to:

You may set different styling formats for your report by using the Features tab on the Report Options dialog box. The Features tab contains different options depending on the selected output format.

For example, if you choose HTML Web Document (HTML) or HTML Table (HTMTABLE) format, you can also:


x
Procedure: How to Request On Demand Paging for an HTML Report

This option causes the server to send the report to your browser one page at a time. You can use controls on your browser to display the next or previous page, all pages, or to navigate to a specific page.

This procedure assumes that the required setup has been done to enable On Demand Paging and that your procedures are being run remotely against a WebFOCUS Reporting Server. For details about on demand paging, see Navigating With On-Demand Paging in the Creating Reporting Applications With Developer Studio manual.

  1. Choose Features from the Report menu.
  2. Ensure that HTML Web Document or HTML Table is selected as the output format.
  3. Select the On Demand Paging check box in the HTML options area.


x
Procedure: How to Apply an Internal Cascading Style Sheet to an HTML Report
  1. Choose Features from the Report menu.
  2. Ensure that HTML Web Document or HTML Table is selected as the output format.
  3. Select the Cascading Style Sheets check box in the Features tab of the HTML Option.

Note: Cascading Style Sheets is selected by default.


x
Procedure: How to Apply an External Cascading Style Sheet to an HTML Report

Cascading Style Sheets (CSS) are an extension to HTML that enable you to specify formatting for an HTML document. To link a CSS file to a report, use the External Cascading Style Sheet URL field in the Report Painter StyleSheet File Selector.

Note: The external CSS (Cascading Style Sheet) file should be saved in an alias on the web server.

  1. Choose Styling from the Report menu.

    The Report Options dialog box opens at the Style tab.

  2. Click the Style File Selection button.

    The StyleSheet Selection dialog box opens.

  3. Enter a URL in the External Cascading StyleSheet URL input field.
  4. Click Finish to close the StyleSheet Selection dialog box.
  5. Click OK to close the Report Options dialog box.

For more information about the StyleSheet File Selector, see Using the StyleSheet File Selector.


x
Procedure: How to Control the Display of the OLAP Control Panel and OLAP Selection Panel
  1. Choose Features from the Report menu.
  2. Ensure that HTML Web Document or HTML Table is selected as the output format.
  3. Select an Enable OLAP option:
    • Disabled. OLAP options are disabled and not shown in the OLAP report.
    • Off. Turns off the OLAP Control Panel and the OLAP Selections pane, but allows OLAP functionality from the report itself. You can access options on right-click menus, drag and drop columns within the report, and use up and down arrows to sort columns from high to low or vice versa.
    • On. Provides access to the OLAP Selections pane from a square button to the left of the column titles. You can open the Control Panel by clicking the OLAP button in the OLAP report.
    • Top Panel. Opens the OLAP Selections pane above the report. The Measures, Graph, and Dimension controls, as well as the band containing the OLAP, Run, and Reset buttons appear above the report output. You can open the Control Panel by clicking the OLAP button on the Selection pane.
    • Bottom Panel. Opens the OLAP Selections pane below the report. The Measures, Graph, and Dimension controls, as well as the band containing the OLAP, Run, and Reset buttons appear below the report output. You can open the Control Panel by clicking the OLAP button on the Selection pane.
    • Hidden Panel. Opens the OLAP report with the OLAP Selections pane hidden. You can perform a variety of analytic tasks from the report itself. Selection Criteria is shown next to the OLAP button.
    • Show Tabbed. For OLAP reports that have multiple dimensions, this option groups the dimension elements under a tab labeled with the dimension name.

    Tip: You can also choose an OLAP options by selecting OLAP from the Report menu.


x
Procedure: How to Enable Auto Drill Down

Auto Drill enables you to transform a report immediately, by drilling down on Dimensions and Measures.

  1. Choose Features from the Report menu.
  2. Ensure that HTML Web Document or HTML Table is selected as the output format.
  3. Select an Automatic Drill Down option:
    • Dimensions to enable automatic drill down functionality for dimensions.
    • Dimensions and Measures to enable automatic drill down functionality for dimensions and measures.

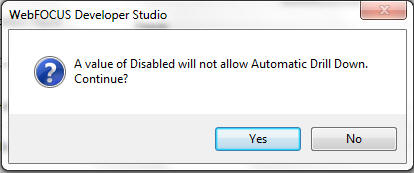
    If you select an option from the Automatic Drill Down list without selecting an option from the Enable OLAP drop-down list, the Enable OLAP option will automatically be set to Off. This is due to Automatic Drill Down requiring an OLAP setting other than Disabled. If you attempt to change the Enable OLAP drop-down back to Disabled, you will receive the following message.

  4. Click the Build Auto Drill Dimensions button to invoke the Dimension Builder. For more information on the Dimension Builders, see the Describing Data With Graphical Tools manual.


x
Procedure: How to Freeze the Scrollable Area for HTML Report Output

You may freeze page headings/footings, report headings/footings, column titles, and totals for your report output. A scroll bar is created so that the headings/footings are locked in place in the HTML output. The freeze option is available from the Features tab of the Report Options dialog box.

Note: The Features tab is only available for the following report output formats: HTML Web Document (HTML), Portable Document Format (PDF), Default, and User (HTML) reports.

  1. In Report Painter, select Features from the Report menu.

    The Report Options dialog box opens at the Features tab.

  2. From the Freeze section, select the freeze type from the Headings/Footings drop-down list.

    The options are:

    • Off. This is the default.
    • On. Freezes the headings/footings, column titles, and totals.
    • Top. Freezes the headings and column titles.
    • Bottom. Freezes the totals and footings.
  3. Enter the scroll height in measurement of inches.

    Note: If the scroll height is not set, the default scroll height is 4 inches.

  4. Click OK to close the Report Options dialog box.
  5. Save and run your report.

In the example below, Freeze is set to ON. The page heading (Sales by Movie), report heading (Sales Report), and column titles (RATING, CATEGORY, TITLE, WHOLESALEPR) are frozen when scrolling in the browser.


WebFOCUS