Displaying Data

In this section:

Reporting, at the simplest level, retrieves field values from a data source and displays those values. There are several ways to do this:

These display options are very flexible. You can report from several fields using a single command and include several different display commands in a single report request.

Tip: The WebFOCUS language provides a few detail and summary variations that the graphical reporting tools do not support. For more information, see the Creating Reports With WebFOCUS Language manual.


Top of page

x
Displaying Individual Values

How to:

The Detail option lists individual values of the field(s) you specify.

For all Detail requests, the number of records retrieved and the number of lines displayed are the same. Unless you choose to sort the data, the Detail option simply displays all the values of the selected fields in the order in which they are accessed from the data source. For details on sorting, see Sorting Data.


x
Procedure: How to Display Detailed Data in Report Painter

Select the Detail button on the Columns toolbar. Detail is selected by default.

Your selection is applied to any fields you select while that button is highlighted. This enables you to choose different display options within the same report.

Tip: After a field is in the Report Painter window, you can change its display mode by selecting the field and clicking either the Detail or Sum button.


Example: Creating a Detail Report

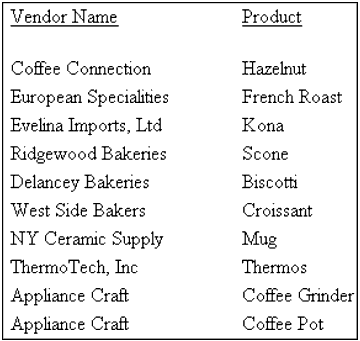
Suppose that you want to compare your product line to that of your competition. The following example shows how to create a detail report that lists the products that Gotham Grinds carries along with the wholesalers from which these products are purchased.

  1. Open the GGPRODS data source in Report Painter.

    Note that the Detail button on the Report Painter toolbar is selected. This is the default.

  2. Double-click or drag VENDOR_NAME from the Fields tab of the Object Inspector.
  3. Double-click or drag PRODUCT_DESCRIPTION from the Fields tab of the Object Inspector.
  4. Run the report by clicking the Run button on the toolbar.

    The report appears in the browser.

Top of page

x
Displaying Summed Values

How to:

The Summary option adds the values of numeric fields. When you use the Summary option, multiple records are read from the data source, but only one summary line is produced.

If you use the Summary option with a non-numeric field, such as an alphanumeric, text, or date field, Report Painter will not add the values. Instead, it will display the last value retrieved from the data source. This may not be useful.

Tip: You can also perform calculations on individual fields. For details, see Performing a Calculation on a Numeric Column.


x
Procedure: How to Display Summary Data in Report Painter

Select the Sum button on the Columns toolbar. (Detail is selected by default.)

Your selection is applied to any fields you select while that button is highlighted. This enables you to choose different display options within the same report.

Tip: After a field is in the Report Painter window, you can change its display mode by selecting the field and clicking either the Detail or Sum button.


Example: Creating a Summary Report

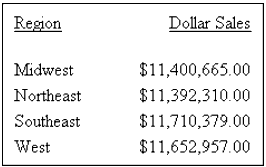
Suppose that you want to see total sales for your various retailers. The following example shows how to create a summary report of total sales for Gotham Grinds stores in each region.

  1. Open the GGSALES data source in Report Painter.
  2. Identify your sort column. Click the By button on the Report Painter toolbar then double-click or drag REGION from the Fields tab of the Object Inspector.
  3. Identify your summary column. Click the Sum button on the Report Painter toolbar then double-click or drag DOLLARS from the Fields tab of the Object Inspector.
  4. Format the Dollar Sales column. Right-click Dollar Sales in the Report Painter window and select Format. Click Decimal in the Format Types box. Select Floating dollar -- M from the Edit Options list. Click OK.
  5. Run the report by clicking the Run button on the toolbar. The report appears in the browser.

Top of page

x
Performing a Calculation on a Numeric Column

How to:

Reference:

You can use built-in operators to perform calculations directly on the values of numeric fields, and display the results of the calculations in your reports. With one exception (percent) these operators only work in Summary mode. For example, you can:

Each prefix operator is applied to a single column and affects only that column.


x
Procedure: How to Perform an Operation on a Column
  1. Select the column in the Report Painter window.
  2. Select the operation to perform.
    • From the Prefix toolbar, select an operator from the Prefix Operator drop-down list.

      or

    • Right-click the column and select Options from the context menu to open the Field Properties dialog box. Click the General tab to select an operator from the Prefix drop-down list.

Tip: In Report Painter, the list of available operators adjusts to show those that are appropriate for the type of field you select. For details, see Operations You Can Perform on Fields.


x
Reference: Operations You Can Perform on Fields

The available operations may vary, depending of the type of field selected. For details on these prefix operators, see the Creating Reports With WebFOCUS Language manual.

Prefix

Function

ASQ.

Computes the average sum of squares for standard deviation in statistical analysis.

AVE.

Computes the average value of the field.

CNT.

Counts the number of occurrences of the field.

CNT.DST.

Counts the number of distinct values within a field.

CT.

Produces a cumulative total of the specified field. This operator only applies when used in subheadings and subfootings.

DST.

Determines the total number of distinct values in a single pass of a data source.

FST.

Generates the first physical instance of the field. Can be used with numeric or text fields.

LST.

Generates the last physical instance of the field. Can be used with numeric or text fields.

MAX. 

Generates the maximum value of the field.

MIN.

Generates the minimum value of the field.

PCT.

Computes a field percentage based on the total values for the field. The PCT operator can be used with detail, as well as summary fields.

PCT.CNT.

Computes a field percentage based on the number of instances found. The format of the result is always F6.2 and cannot be reformatted.

RPCT.

Computes the percentage of a field based on the total values for the field across a row.

ST.

Produces a subtotal value of the specified field at a sort break in the report. This operator only applies when used in subheadings and subfootings.

SUM.

Sums the number of occurrences of the field.

FROLL

For data sources that use the parent/child hierarchy model, you can show either full or partial aggregation in the report output.

Note: This option is only available when using a multi-dimensional data source. For more information about using the FROLL prefix operator with a multi-dimensional data source, see Manipulating Aggregated Data in an Essbase or SAP BW Hierarchy in the Creating Reporting Applications With Developer Studio manual.

TOT.

Counts the occurrences of the field for use in a heading (includes footings, subheadings, and subfootings).


x
Displaying Missing Data

How to:

When reporting against a hierarchical data source, you can display segment instances that lack descendants by applying the All operator to a field.

For example, imagine that you want to create a salary report that highlights salary increases, but lists the names of all employees in the company. When reporting against a hierarchical data source like FOCUS, you can display segment instances that lack descendants, both those that received increases and those that did not. When you apply the All operator to the field that contains employee names, WebFOCUS displays the names but inserts a character indicating that there is no data present for any missing field values in the report. In this case, that means the salary increase information. The default missing data character is a period. For an illustration, see Including a Missing Segment Instance With the All Operator.

All can be applied to display fields and sort fields. It can be applied to multiple fields in a request and combined with operators that perform calculations on the selected fields. For details, see Operations You Can Perform on Fields.

Note: If your request includes selection criteria that screen fields in segments that are missing instances, the report omits the parent instances even when you use the All operator. For details, see Handling Records With Missing Field Values in the Creating Reports With WebFOCUS Language manual.


x
Procedure: How to Include a Missing Segment Instance in a Report

In the Report Painter window:

  1. Select a column that you want to include in the report even if there are missing instances of data for related fields in the report.
  2. Choose Options from the Properties menu.

    or

    Right-click and select Options from the context menu.

  3. The Field Properties dialog box opens. Select the General tab.
  4. Select the ALL operator from the Prefix drop-down list.


Example: Including a Missing Segment Instance With the All Operator

The following request displays the salary history of each employee. The report is sorted by last name (LAST_NAME), first name (FIRST_NAME), and date of increase (DAT_INC), with the ALL operator applied to LAST_NAME. Notice that the names Davis and Gardner appear in the report even though they did not receive salary increases.

The output is:

LAST_NAME
FIRST_NAME
DAT_INC
SALARY
BANNING
BLACKWOOD
CROSS

DAVIS
GARDNER
GREENSPAN

IRVING

JONES

MCCOY
MCKNIGHT

ROMANS
SMITH 
STEVENS
JOHN
ROSEMARIE
BARBARA

ELIZABETH
DAVID
MARY

JOAN

DIANE

JOHN
ROGER
ANTHONY
MARY
RICHARD
ALFRED
82/08/01
82/04/01
81/11/02
82/04/09
82/04/01
82/06/11
82/01/04
82/05/14
82/05/01
82/06/01
82/01/01
82/02/02
82/05/14
82/07/01
82/01/01
82/01/04
82/05/14
81/01/01
82/01/01
$29,700.00
$21,780.00
$25,775.00
$27,062.00
$20,000.00
$21,500.00
$24,420.00
$26,862.00
$20,750.00
$22,480.00
$20,480.00
$23,000.00
$28,100.00
$21,120.00
$23,200.00
$29,050.00
$26,500.00
$27,000.00
$28,100.00

WebFOCUS