Creating an Active Technologies Dashboard

In this section:

This topic describes the WebFOCUS syntax used to:


Top of page

x
Positioning and Sizing Components on an Active Technologies Dashboard

An active dashboard for Adobe Flash Player or for PDF uses pixels as the unit of measurement by default, while tools such as Document Composer and InfoAssist use points as the unit of measurement.

Both Document Composer and InfoAssist provide a WebFOCUS setting so that the design-time and run-time positioning and sizing of components correspond to each other. The setting is ACTIVE_UNITS=PTS, which changes the unit of measurement to points. As a result, some components on an existing active dashboard for Adobe Flash Player or for PDF may appear to overlap at design time in Document Composer, while they appear correctly positioned and sized at run time.

In the Document Composer Text Editor, you can view the WebFOCUS source code for the setting. The syntax is

ACTIVE_UNITS={PTS|PX}

where:

PTS

Sets the active unit of measurement to points. In Document Composer and InfoAssist, points are used for the positioning and sizing of components on an active dashboard for Adobe Flash Player or for PDF. With this setting, the components on an active dashboard have the same position and size at run time as they have at design time (WYSIWYG).

PX

Sets the active unit of measurement to pixels. By default, pixels are used for the positioning and sizing of components on an active dashboard for Adobe Flash Player or for PDF. With this setting, the components on an active dashboard have a different position and size at run time as they have at design time. This is the default value if no other value is set. It is provided for backward compatibility.

The following is an example of the WebFOCUS code for an active dashboard for Adobe Flash Player, with the ACTIVE_UNITS setting shown in bold.

SECTION=section1, LAYOUT=ON, METADATA='0.5^0.5^0.5^0.5^4',
MERGE=OFF, ORIENTATION=PORTRAIT, PAGESIZE=Letter, ACTIVE_UNITS=PTS, $

Top of page

x
Sizing a Grid Component With Respect to Its Container

You can use the following WebFOCUS StyleSheet setting to contain a grid component inside its container on an active dashboard. You must include this setting in the grid component (that is, in the TABLE FILE procedure for the report) inside an active dashboard that you create using COMPOUND syntax.

The StyleSheet syntax is

ARREPORTSIZE={FLOWING|DIMENSION}

where:

FLOWING

Specifies that the size of the grid component (the active report) will dynamically change as needed and will override the size settings for the grid component. This is the default value.

Note: If values for DIMENSION are set in the TABLE FILE procedure for the report, the output formats FLEX and APDF will respect the size set by these values.

DIMENSION

Specifies that the dimensions (height and width) set for the grid component in the active dashboard will be respected. The size of the grid component will not change dynamically, but the grid will be contained inside the container when used in a COMPOUND active dashboard procedure. If the report does not fit inside the container, scroll bars will be added automatically around the report.


Top of page

x
Hiding a Report Object on an Active Technologies Dashboard

How to:

You may have the need to hide an active report object on an active dashboard, for example, when you want to display non-data related objects in the first tab of the dashboard and place report and chart objects in the subsequent tabs. You can hide the first report object using HIDDEN=ON syntax in your WebFOCUS code.

The data from the hidden report is still available for use in the global filter or other filter control.


x
Syntax: How to Hide a Report Object on an Active Technologies Dashboard
HIDDEN={ON|OFF}

where:

ON
Hides the active report object on the active dashboard.
OFF
Displays the active report object on the active dashboard. This is the default value.


Example: Hiding a Report Object on an Active Technologies Dashboard

The following sample COMPONENT declaration in the COMPOUND LAYOUT code hides the entire active report object, component R0, on the active dashboard. You can still use the data from the hidden report in the global filter or other filter control.

COMPONENT=R0, TYPE=REPORT, POSITION=(0 0), HIDDEN=ON,$

Top of page

x
Configuring Active Technologies Form Controls With WebFOCUS Syntax

In this section:

In Document Composer and InfoAssist, you can add one or more active form controls to an active dashboard in order to create complex filter relationships among report and chart components. An active form control is available for an active dashboard in HTML and for an active dashboard for Adobe Flash Player and for PDF.

The following are the types of active form controls that you can use to apply filters to an active dashboard:

This topic describes the WebFOCUS code that supports the implementation of the preceding active form controls.


x
WebFOCUS Code

The syntax for OBJECT within a PAGELAYOUT grouping in a COMPOUND LAYOUT request is

OBJECT={LIST|COMBOBOX|TEXTINPUT|CHECKBOX|RADIOBUTTON}, NAME=’object_name',
ARDATA_REPORT='name_of_source_report', ARDATA_COLUMN='column_name',
ARFILTER_TARGET=’target_report_name1,target_report_name2,...',
ARFILTER_CONDITION='{EQ|NE|LT|LE|GT|GE}', ARFILTER_SHOWALL={ON|OFF},
ARFILTER_PARENT=’name_of_parent_object', ARDATA_FILTERONLY={ON|OFF},
ARFILTER_MULTIPLE={ON|OFF}, ARFILTER_ACTIVE={ONLOAD|'"alpha_value"'|'numeric_value'},
POSITION=(left top), DIMENSION=(width height),
SIZE=font_size, COLOR=font_color, BACKCOLOR=background_color, $

where:

OBJECT={LIST|COMBOBOX|TEXTINPUT|CHECKBOX|RADIOBUTTON}

Is the type of active form control. The available values are:

  • LIST adds a list box.
  • COMBOBOX adds a drop-down list.
  • TEXTINPUT adds a text input field. This field is case-sensitive. The value that is typed in the field at run time must match the exact case of the value that is stored in the database.
  • CHECKBOX adds a check box.
  • RADIOBUTTON adds a radio button.
NAME='object_name'

Is the name of the active form control.

ARDATA_REPORT='name_of_source_report'

Is the name of the source report that contains the data that populates the active form control with selection values from which you choose at run time.

This property is required for the LIST, COMBOBOX, CHECKBOX, and RADIOBUTTON controls. This property is optional for the TEXTINPUT control.

ARDATA_COLUMN='column_name'

Is the name of the specific column in the source report that populates the data selection values in the LIST, COMBOBOX, CHECKBOX, and RADIOBUTTON controls.

For the TEXTINPUT control, this property is the column to which the filter condition is applied. There is no initial data value for the TEXTINPUT control at run time. It remains blank until the user supplies a value.

This property is required. The column must exist in both the source report and target report.

The active form controls do not support the use of ACROSS sort fields in active reports or charts. You cannot use ACROSS sort fields to populate the data selection values and apply filters.

ARFILTER_TARGET=’target_report_name1,target_report_name2,...’

Is the name of the target report or target chart component that is filtered by the active form control. You can specify one or more target report or target chart components. To specify multiple target components, provide a list of report or chart component names, separating each name with a comma (,).

This property is required.

ARFILTER_CONDITION='{EQ|NE|LT|LE|GT|GE}'

Is the filter condition that is used. The available values are:

  • EQ. Equal to. This is the default value.
  • NE. Not equal to.
  • LT. Less than.
  • LE. Less than or equal to.
  • GT. Greater than.
  • GE. Greater than or equal to.
ARFILTER_SHOWALL={ON|OFF}

Specifies whether or not to show the string value "[ALL]" in the list of data selection values for the active form control. The default value is ON, which displays the string value "[ALL]" in the list of data selection values. At run time, selecting this value from the control displays all the data in the report. Set this property to OFF to suppress the string value "[ALL]" in the active form control.

This property is optional for the LIST, COMBOBOX, CHECKBOX, and RADIOBUTTON controls.

This property does not apply to the TEXTINPUT control. For the TEXTINPUT control, removing the value supplied in the text input field removes the filter and displays all the values in the target reports and charts.

ARFILTER_PARENT=’name_of_parent_object'

Is the name of the parent active form control using the NAME property to create a nested (parent/child) filter relationship between active form controls.

This is a user-specified property. There is no default value.

ARDATA_FILTERONLY={ON|OFF}

Is a property that is used internally by Developer Studio.

The default value is ON for chained active form controls. The source report for a control can also be a target report for another control that applies a filter to the report. This property allows you to decide whether or not to filter the data in a control populated by a report that is filtered by another control. When this property is set to OFF, all the values for the column in the report are displayed as the data selection values for the control. When this property is set to ON, only the values after a filter has been applied are available as the data selection values.

ARFILTER_MULTIPLE={ON|OFF}

Is an optional property for the LIST and CHECKBOX controls. When this property is set to ON, you can select multiple values from a LIST or CHECKBOX control at run time. With a list box, hold down the Shift key to select multiple values in sequence, or hold down the Ctrl key to select multiple values that are not in the order listed at run time. With check boxes, you can simply check or uncheck multiple check boxes at run time.

The default value is OFF.

This property does not apply to the COMBOBOX, RADIOBUTTON, or TEXTINPUT control, because those controls allow only single-value selection at run time.

ARFILTER_ACTIVE={ONLOAD|'"alpha_value"'|'numeric_value'}

Is an optional property for an active form control. It sets the default filter value in an active form control and at run time automatically applies the filter to the data in the report and chart objects on an active dashboard.

  • ONLOAD works as follows.
    • In the COMPOUND LAYOUT code for an active form control, ARFILTER_ACTIVE=ONLOAD is not set, and ARFILTER_SHOWALL=OFF.

      When you are using InfoAssist, you can create a report for an active dashboard with an active form control. Deselect the Include All check box (ARFILTER_SHOWALL=OFF) in the Active Dashboard Properties dialog box.

      For example, ARFILTER_SHOWALL=OFF is included in the following code for a drop-down list (COMBOBOX) on an active dashboard. ARFILTER_ACTIVE=ONLOAD is not set.

      OBJECT=COMBOBOX, NAME='combobox1', POSITION=(2.604 1.042),
         DIMENSION=(2.292 0.229), ARFILTER_NAME='combobox1',
         ARDATA_REPORT='report1', ARDATA_COLUMN='ST',
         ARFILTER_TARGET='report1', ARFILTER_SHOWALL=OFF, $

      In the output, the drop-down list displays the default value CA (the first value in the list) for the State column. However, on the first execution, the data in the tabular report is not filtered by CA. Instead, the tabular report displays all the data, as shown in the following image.
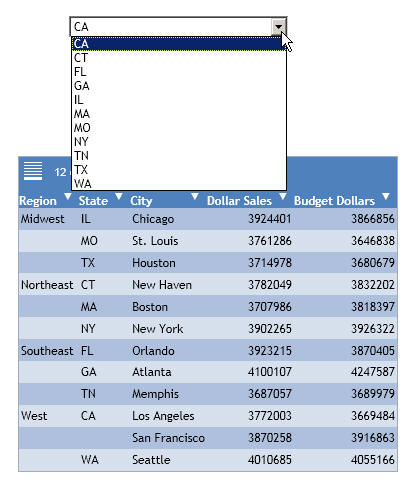
      Note on default behavior:

      If ARFILTER_ACTIVE is not explicitly set by default, an active form control on a dashboard does not work as intended at initial run time. On the first execution, all data is returned to the report and chart objects on the dashboard, regardless of the value that is displayed in the active form control. In addition, the report data does not necessarily correspond to the value displayed in the active form control. On subsequent executions, the report data is filtered by the value selected in the active form control.

    • In the COMPOUND LAYOUT code for an active form control, ARFILTER_ACTIVE=ONLOAD and ARFILTER_SHOWALL=OFF.

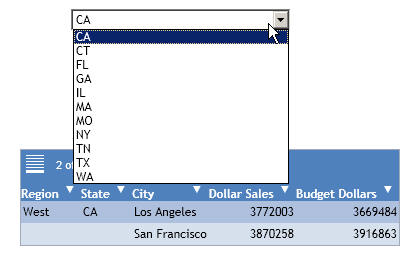
      When ARFILTER_ACTIVE=ONLOAD is set, the report data at run time is filtered by the first selection value in the particular active form control that is set.

      For example, ARFILTER_ACTIVE=ONLOAD and ARFILTER_SHOWALL=OFF are included in the following code for a drop-down list (COMBOBOX) on an active dashboard:

      OBJECT=COMBOBOX, NAME='combobox1', POSITION=(2.604 1.042),
        DIMENSION=(2.292 0.229), ARFILTER_NAME='combobox1',
        ARDATA_REPORT='report1', ARDATA_COLUMN='ST',
        ARFILTER_TARGET='report1', ARFILTER_SHOWALL=OFF,
        ARFILTER_ACTIVE=ONLOAD, $ 

      In the output, the drop-down list displays the default value CA (the first value in the list) for the State column. The data in the tabular report is filtered by CA, as shown in the following image.
  • In the COMPOUND LAYOUT code for an active form control, ARFILTER_ACTIVE='"alpha_value"'.

    An alpha_value is the default filter value that you specify for display in an active form control for an alphabetic column. All data in the report and chart objects on the dashboard is automatically filtered at run time, based on the alpha_value.

    For example, ARFILTER_ACTIVE='"IL"' and ARFILTER_SHOWALL=ON are included in the following code for a drop-down list (COMBOBOX) on an active dashboard:

    OBJECT=COMBOBOX, NAME='combobox1', POSITION=(2.604 1.042),
      DIMENSION=(2.292 0.229), ARFILTER_NAME='combobox1',
      ARDATA_REPORT='report1', ARDATA_COLUMN='ST',
      ARFILTER_TARGET='report1', ARFILTER_SHOWALL=ON,
      ARFILTER_ACTIVE='"IL"', $

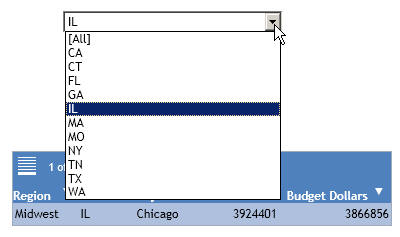
    In the output, the drop-down list displays the default value IL for the State column. The data in the tabular report is filtered by IL, as shown in the following image.
    You can specify more than one default value when ARFILTER_MULTIPLE is set to ON for a list control or check box control.

    If you specify more than one alpha_value, use the syntax:

    '"alpha_value1","alpha_value2",...'
  • In the COMPOUND LAYOUT code for an active form control, ARFILTER_ACTIVE='numeric_value'.

    A numeric_value is the default filter value that you specify for display in an active form control for a numeric column. All data in the report and chart objects on the dashboard is automatically filtered at run time, based on the numeric_value.

    You can specify more than one default value when ARFILTER_MULTIPLE is set to ON for a list control or check box control.

    If you specify more than one numeric_value, use the syntax:

    'numeric_value1,numeric_value2,...'
POSITION=(left top)

Is the position of the active form control on the active dashboard.

  • The value left indicates the position of the active form control from the left edge of the active dashboard, in the units of measurement set for the dashboard (for example, inches, centimeters, or points). You can set the units of measurement for a dashboard using the UNITS keyword in your WebFOCUS code or using a graphical tool, such as InfoAssist. For more information, see the applicable reporting language and reporting tools manuals.
  • The value top indicates the position of the active form control from the top edge of the active dashboard, in the units of measurement set for the dashboard.
DIMENSION=(width height)

Is the size of the active form control on the active dashboard.

  • The value width is the width of the active form control on the active dashboard, in the units of measurement set.
  • The value height is the height of the active form control on the active dashboard, in the units of measurement set.
SIZE=font_size

Is the size of the font used to display the values in the active form control, for example, 12.

COLOR=font_color

Is the color of the font used to display the values in the active form control, for example, BLACK.

BACKCOLOR=background_color

Is the background color for the active form control. WHITE is the default value. A valid value is either a preset color name in single quotation marks, for example, 'ORANGE', or the RGB (red green blue) numeric values, for example, RGB(255 252 204), which is pale yellow.


x
Example: Adding a Sample Drop-Down List

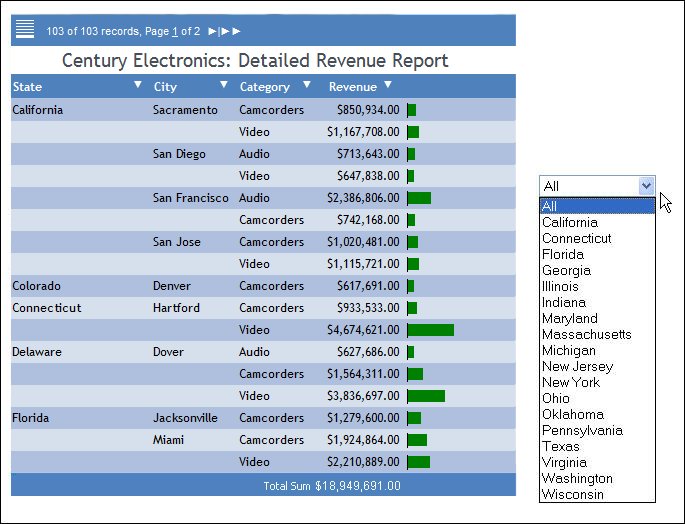
The following image shows a partial active dashboard with a single tabular active report and a drop-down list (COMBOBOX). The drop-down list is positioned to the right of the active report. The drop-down list allows you to filter data in the tabular report on the value of the STATE column in the procedure. The data selection value All is provided in the drop-down list. When selected, All displays all the data in the report.
The WebFOCUS code for the drop-down list is as follows.

OBJECT=COMBOBOX, NAME='combobox1',
POSITION=(6.010 2.167), DIMENSION=(1.667 0.208),
ARDATA_REPORT='report1', ARDATA_COLUMN='STATE',
ARFILTER_TARGET='report1', ARFILTER_CONDITION='EQ',
ARFILTER_SHOWALL=ON,  $


x
Reference: Usage Notes for Active Technologies Form Controls

The following applies when you are designing an active form control:

Active Technologies do not support the FONT attribute in the syntax for an OBJECT. You cannot change the type of font used to display the values in an active form control.
Top of page

x
Creating a Heading Area With Controls Using the Dashboard Bar

In this section:

How to:

You can create a heading area for an active dashboard by adding a page layout for the dashboard bar (PAGELAYOUT=DASHBOARDBAR). On the page for the dashboard bar, you can insert Active Technologies form controls, reports, and charts that are always displayed above the dashboard tabs.

This feature is available for a compound layout report with output format AHTML, FLEX, or APDF.

You can create a maximum of one page layout for the dashboard bar. Though you can place multiple components on the full page, we recommend that you avoid large reports and charts. If the page for the dashboard bar contains large reports and charts, it may fill up the entire visible area of the browser or monitor, and the heading area for the dashboard may appear bigger than the dashboard itself. This effect reduces the usability of the dashboard.


x
Design Requirements

To create a heading area for an active dashboard, you must have one report component inside the page layout for the dashboard bar. You can optionally hide this report component. For more information on this feature, see Hiding a Report Object on an Active Technologies Dashboard.

By default, Document Composer generates the syntax for an empty report when you create an active dashboard.


x
Syntax: How to Create a Heading Area With Controls Using the Dashboard Bar

The following syntax shows the PAGELAYOUT definition for DASHBOARDBAR in a section in a compound layout report. It includes a required report component, which in turn can be followed by other components and objects.

For details on the syntax used in Document Composer to create a compound layout report, see the Creating Reports With WebFOCUS Language manual.

Use the following syntax

COMPOUND LAYOUT PCHOLD FORMAT output_format 
SECTION=section_name, LAYOUT=ON, MERGE={AUTO|OFF},
   ARGRAPHENGINE=chart_engine...,$
PAGELAYOUT=DASHBOARDBAR,$
COMPONENT=component_name, TYPE=REPORT, POSITION=(x y),
   HIDDEN={ON|OFF}...,$
.
.
.
END
COMPOUND END

where:

output_format

Is AHTML, FLEX, or APDF.

section_name

Is a unique identifier for the section. It can be up to 16 characters long.

LAYOUT=ON

Specifies that the section uses a complex layout. LAYOUT=ON is the only available option at this time.

MERGE={AUTO|OFF}

Enables you to choose one of two options supported by the Active Technologies output formats. The default value is OFF. For more information on the use of this attribute, see Adding Active Technologies Form Controls and Establishing Relationships and Controlling the Display of the Global Filter Icon and Dashboard Bar.

chart_engine

Is any chart engine, for example, JSCHART.

PAGELAYOUT=DASHBOARDBAR

Must be DASHBOARDBAR.

component_name

Is a unique identifier for the report component that is required inside the page layout. It is the name of a report that appears later in the request. The component name can be up to 16 characters long.

TYPE=REPORT

Is the type of component. REPORT is the only supported value.

x y

Is the (x y) coordinate on the page where the upper-left corner of the component is placed. All coordinates are in current UNITs (the default value is inches), and (0 0) is the upper-left corner of the physical page.

HIDDEN={ON|OFF}

Either hides the active report component on the active dashboard (ON), or displays the active report component on the active dashboard (OFF). The default value is OFF.

Note: In the preceding syntax, ellipses (...) indicate that you can include other valid attributes.


Example: Creating a Heading Area With Controls Using the Dashboard Bar

The following code creates a heading area for an active dashoard.

For details on the syntax used to create the dashboard with a drop-down list (COMBOBOX), see Configuring Active Technologies Form Controls With WebFOCUS Syntax.

COMPOUND LAYOUT PCHOLD FORMAT AHTML 
SECTION=S1, LAYOUT=ON, MERGE=OFF, ARGRAPHENGINE=JSCHART,
   ARSTYLESET=dashbar, ARICONSET=WHITE3,$ 
PAGELAYOUT=DASHBOARDBAR,$
COMPONENT=R0, TYPE=REPORT, POSITION=(3 1), DIMENSION=(3 2),$ 
COMPONENT=G0, TYPE=REPORT, POSITION=(7 1), DIMENSION=(4 3),$
OBJECT=STRING, NAME=Text_1, POSITION=(0.2 0.2), TEXT='Regional Sales',
   FONT='ARIAL', SIZE=20, COLOR=RGB(0 72 132), WRAP=OFF,
   DIMENSION=(4.270833 0.71875),$
OBJECT=COMBOBOX, NAME='object6', COLOR='blue', SIZE=12, FONT=ARIAL,
   ARFILTER_SHOWALL=OFF, ARFILTER_TARGET='R1,R2,G0',
   ARDATA_COLUMN=REGION, ARDATA_REPORT=R0, ARFILTER_CONDITION=EQ,
   POSITION=(0.2 1), DIMENSION=(2 .5), ARFILTER_ACTIVE=ONLOAD,$
PAGELAYOUT=1, TEXT=layout 1, BACKCOLOR=RGB(0 72 132),$
COMPONENT=R1, TYPE=REPORT, POSITION=(.5 .5), DIMENSION=(4.2 4),$
PAGELAYOUT=2, TEXT=layout 2, BACKCOLOR='aqua',$
COMPONENT=R2, TYPE=REPORT, POSITION=(.5 .5), DIMENSION=(6.3 4),$
END
SET COMPONENT=R0
TABLE FILE GGSALES
SUM DOLLARS
BY REGION
ON TABLE SET STYLE *
INCLUDE = ENInformationBuilders_Medium1,$
ENDSTYLE
END
SET COMPONENT=G0
GRAPH FILE GGSALES
SUM DOLLARS
BY REGION
BY CATEGORY
ON GRAPH SET LOOKGRAPH PIE
ON GRAPH PCHOLD FORMAT AHTML
ON TABLE SET STYLE *
INCLUDE = ENInformationBuilders_Medium1,$
TYPE=REPORT,
     COLUMN=N1,
     HIDE=ON,
$
ENDSTYLE
END
SET COMPONENT=R1
TABLE FILE GGSALES
SUM UNITS BUDUNITS
BY REGION
BY ST
BY CATEGORY
BY PRODUCT
ON TABLE SET STYLE *
INCLUDE = ENInformationBuilders_Medium1,$
TYPE=REPORT,
     LINES-PER-PAGE=10,
$
ENDSTYLE
END
SET COMPONENT=R2
TABLE FILE GGSALES
SUM BUDDOLLARS DOLLARS
BY REGION
BY CATEGORY
BY PRODUCT
ON TABLE SET STYLE *
INCLUDE = ENInformationBuilders_Medium1,$
ENDSTYLE
END 
COMPOUND END

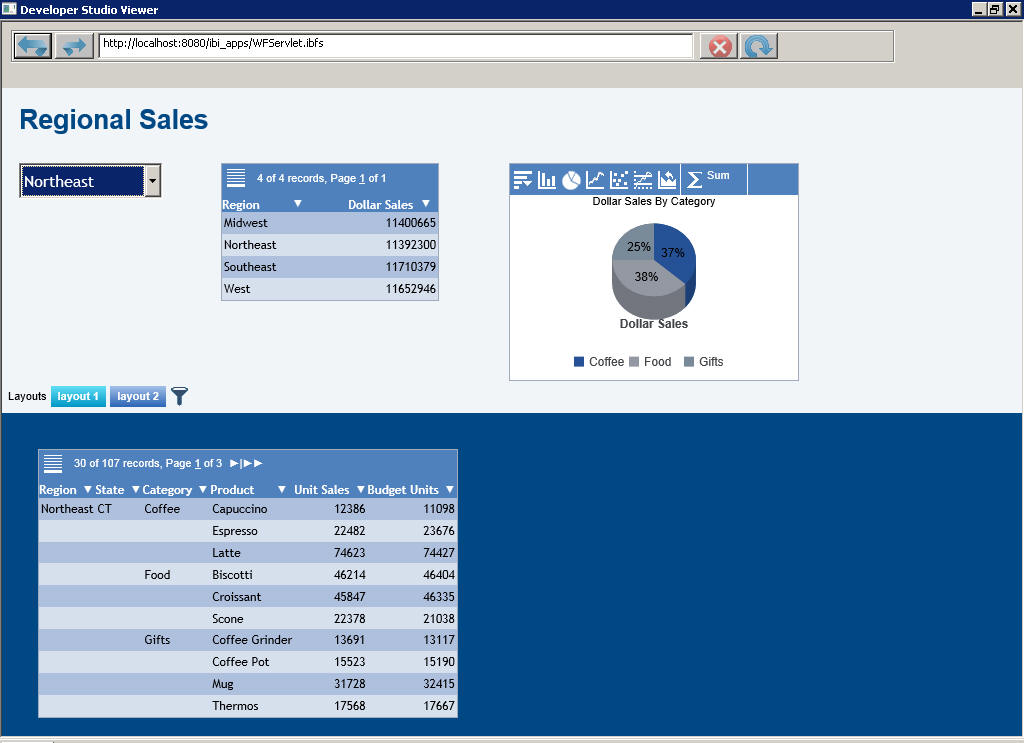
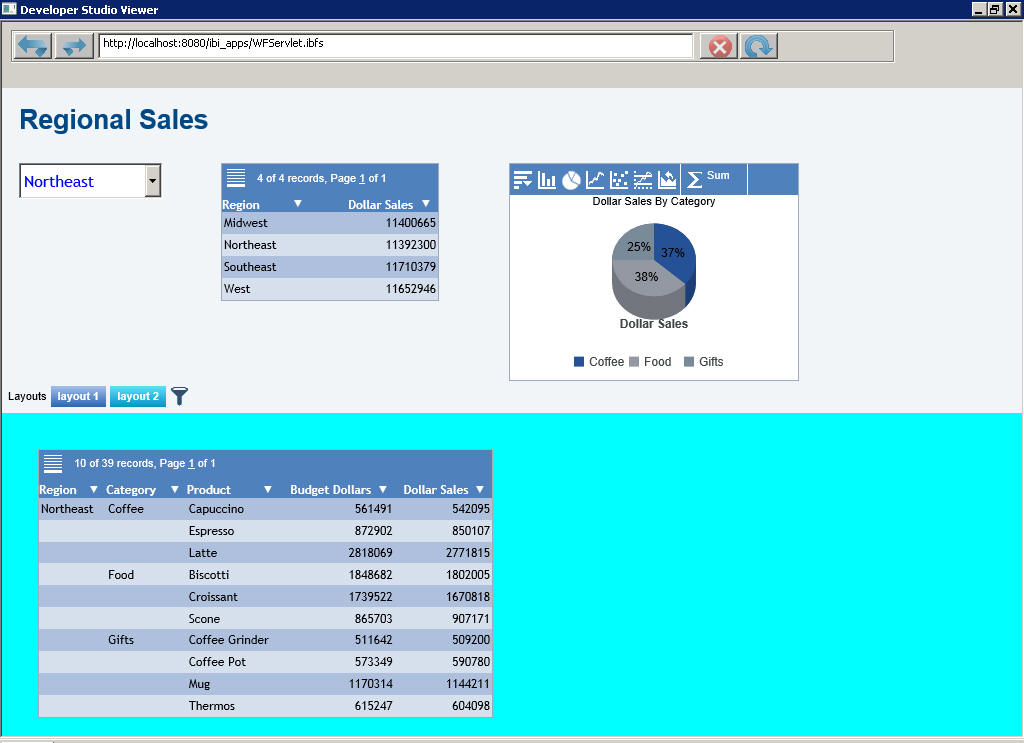
When you run the compound layout report, the output that is generated is shown in the images that follow.

The heading area for the active dashboard is at the top of the window. A tabular active report on the dashboard is in the lower half of the window, on a navy background.

The heading area for the active dashboard contains an active chart, a tabular active report, and a drop-down list for filtering the data on the dashboard.

The filter from the drop-down list is applied to the components associated with this active form control, namely, the active chart at the top and the tabular active report in the lower half of the window.

The heading area for the active dashboard remains above all the tabs on the dashboard. As shown in the following image, the filter from the drop-down list in the heading area is also applied to the tabular active report on the second tab of the dashboard to broaden the scope of data analysis.


Top of page

x
Formatting a Text String

Several formatting attributes for a text string (OBJECT=STRING) are supported when you create an active dashboard in Document Composer or InfoAssist. The attributes include:

For details on the syntax used for formatting a text string with the preceding attributes, see the information on creating a compound layout report in the Creating Reports With WebFOCUS Language manual.

The following apply:


Example: Supported and Unsupported Syntax

Active Technologies support the following sample syntax:

OBJECT=STRING, NAME='text1', TEXT='Regional Sales',
POSITION=(1.115 0.83), MARKUP=ON, WRAP=ON, DIMENSION=(1.688 2.385),
METADATA='Z-INDEX: 1; POSITION: absolute; WIDTH: 1.688in;
WORD-WRAP: break-word; HEIGHT: 2.385in; TOP: 0.83in; LEFT: 1.115in',
FONT='Trebuchet MS', SIZE=20, COLOR='red', $

Active Technologies no longer support this sample syntax:

OBJECT=STRING, NAME='text1', TEXT='<font face="TREBUCHET MS" size=20
color="red">Regional Sales<BR></font>', POSITION=(0.917 1.063), MARKUP=ON,
DIMENSION=(2.302 0.250), METADATA='', $


Example: Formatting a Text String

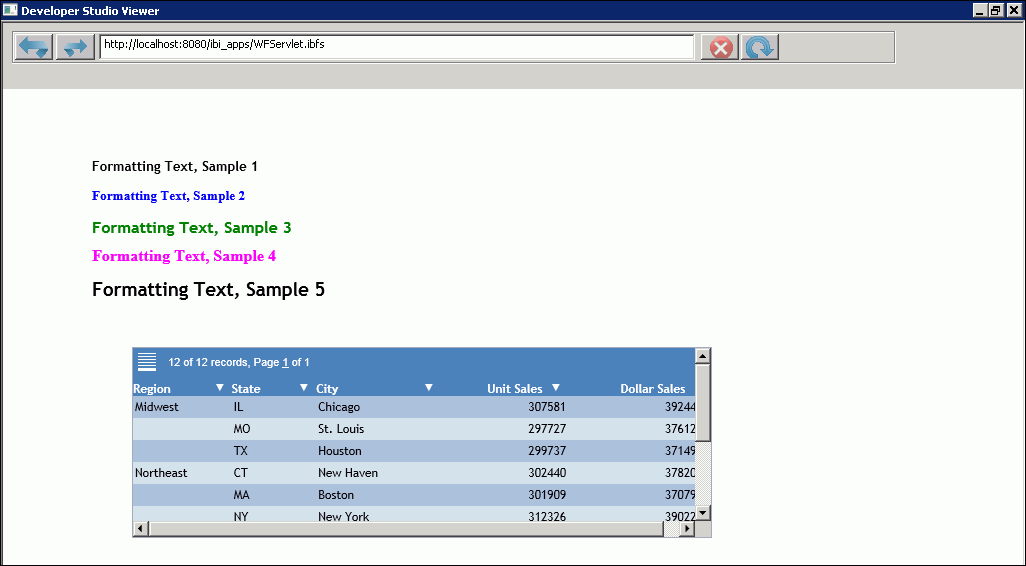
The following text strings are formatted with different attribute values to illustrate the options that are available.

The following image shows the preceding text strings in the upper left corner of a sample active dashboard.


Top of page

x
Controlling the Display of the Global Filter Icon and Dashboard Bar

The following WebFOCUS syntax controls the display of the Global Filter icon and dashboard bar on an active dashboard.

SHOW_GLOBALFILTER={ON|OFF}

where:

ON

Displays the Global Filter icon and dashboard bar on an active dashboard. This is the default value.

OFF

Suppresses the display of the Global Filter icon and dashboard bar on an active dashboard when both of the following apply:

  • You have not set a coordinated field (MERGE=AUTO) option.
  • The dashboard does not have multiple PAGELAYOUTs.

By default, Document Composer and InfoAssist add the following syntax for the output formats AHTML, FLEX, and APDF.

SECTION=section1, LAYOUT=ON, SHOW_GLOBALFILTER=OFF,...$

Setting the MERGE=AUTO option or having multiple PAGELAYOUTs overwrites the preceding SHOW_GLOBALFILTER=OFF setting and displays the Global Filter icon and dashboard bar.


WebFOCUS