Creating an HTML5 Graph

How to:

WebFOCUS supports a graph output format that takes advantage of the HTML5 standard. The charts are rendered in the browser as high quality interactive vector graphics using a built-in JavaScript engine. Note that older browsers do not support all of the features of the HTML5 standard.

You can use the SET AUTOFIT command to make the HTML5 graph output resize to fit into the container in which it is placed.


Top of page

x
Syntax: How to Create HTML5 Graph Output

In your graph request, include the following commands:

ON GRAPH SET ARGRAPHENGIN JSCHART
ON GRAPH PCHOLD FORMAT JSCHART

or, you can set the ARGRAPHENGIN parameter outside of the request:

SET ARGRAPHENGIN = JSCHART

then, in the request, include the following command

ON GRAPH PCHOLD FORMAT JSCHART

If either the SET ARGRAPHENGIN or ON GRAPH PCHOLD FORMAT JSCHART command is not issued, server-side graphics are generated. This graph output format is not supported in an Active Technologies request.


Example: Creating an HTML5 Vertical Bar Graph

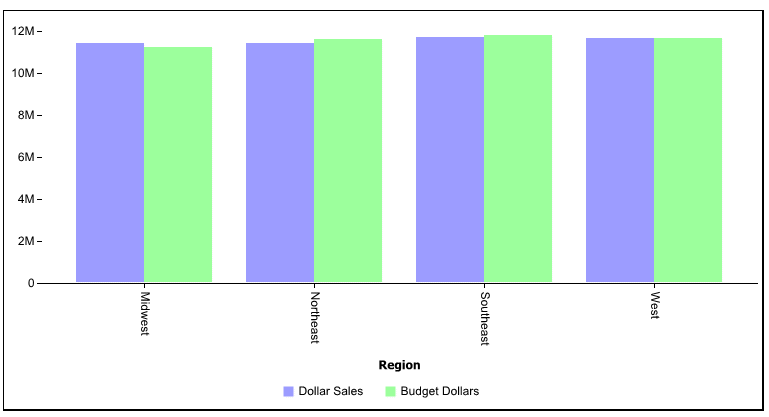
The following request against the GGSALES data source creates an HTML5 vertical bar graph:

GRAPH FILE GGSALES
SUM DOLLARS BUDDOLLARS
BY REGION
ON GRAPH PCHOLD FORMAT JSCHART
ON GRAPH SET ARGRAPHENGIN JSCHART
ON GRAPH SET LOOKGRAPH VBAR
END

The output is:

Top of page

x
Syntax: How to Resize HTML5 Graph Output to Fit Its Container
ON GRAPH SET AUTOFIT {OFF|ON|RESIZE}

where:

OFF

Respects the dimensions specified by the HAXIS and VAXIS parameters.

ON

Always resizes the HTML5 graph output to fit its container.

RESIZE

Respects the dimensions specified by the HAXIS and VAXIS parameters initially, but resizes the graph output if the container is resized.


WebFOCUS