In this section: |
The risers and markers in a graph are initially determined by the graph type that is selected with the GraphType property. For example, GraphType 17 selects a vertical bar graph and the risers are drawn in the graph as vertical bars that are auto-shaded and imaged with a 2.5D effect by default. GraphType 54 selects a horizontal line graph in which risers are drawn as lines that are auto-shaded and imaged with a 2.5D effect by default.
You can use properties and methods to change how risers and markers are imaged in the graph. For more information about risers and markers in pie and stock graphs, see Pie Graph Properties and Methods and Stock Graph Properties and Methods.
These properties control risers and markers in a graph:
In addition to the riser-specific properties, you can use these methods to get/set riser and marker attributes:
You can use the setMarkerShape() method to set the shape of markers in a graph. Select from the following predefined shapes:
You can use the setSeriesType() method to assign a riser type to individual series. This method allows you to use different types of risers for series in a graph. For example, series one could use bar risers, series two could use line markers, and series three could use area risers.
When you use these methods, you may supply the object ID of a riser/marker as an input parameter to identify the object to which the attribute is applied. If a riser or marker is not specified, the attribute is retrieved from or assigned to the first item in the selection list. If the object ID does not identify a riser or marker object or the first item in the selection list is not a riser or marker, a set operation will apply the attribute to the object but it will not have any effect on the appearance of the graph.
You can use the following methods to define the use of exceptional/highlighted risers in a graph. This is how conditional styling is implemented behind the scenes.
How to: |
There are two methods you can use to automatically render the color and style of graph risers:
You can automatically shade groups of risers by lightening or darkening the color values in each successive group. You implement this type of shading by setting the color mode to 4, setting a looping index equal to the number of risers in each group, and setting an automatic color lightening or darkening factor:
setColorMode(4);
setSeriesLooping(s);
setAutoColorLerpFactor(f);
where:
Implements automatic repeated riser shading.
Identifies the number of risers in each group on the graph.
Is a double-precision number between -1 and 1 that represents the factor for lightening or darkening each successive group of risers. A positive factor specifies that each successive group of risers will be lighter than the previous group. A negative number specifies that each successive group of risers will be darker than the previous group. Zero indicates that each successive group of risers will be shaded exactly the same as the previous group.
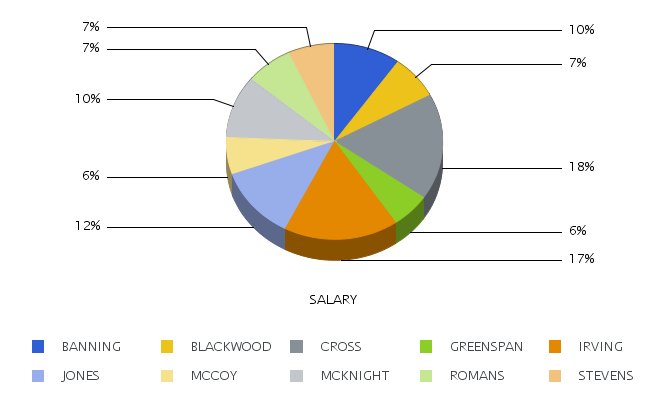
The following request implements repeated lightening of groups of risers. It sets the color mode to 4, the series looping index to 5, and the automatic color factor to 1:
-DEFAULTH &WF_STYLE_HEIGHT='405';
-DEFAULTH &WF_STYLE_WIDTH='770';
GRAPH FILE EMPLOYEE
-* Created by Info Assist for Graph
SUM EMPLOYEE.PAYINFO.SALARY
BY EMPLOYEE.EMPINFO.LAST_NAME
WHERE EMPLOYEE.EMPINFO.LAST_NAME NE 'SMITH';
ON GRAPH PCHOLD FORMAT PNG
ON GRAPH SET HTMLENCODE ON
ON GRAPH SET GRAPHDEFAULT OFF
ON GRAPH SET VZERO OFF
ON GRAPH SET HAXIS &WF_STYLE_WIDTH
ON GRAPH SET VAXIS &WF_STYLE_HEIGHT
ON GRAPH SET UNITS PIXELS
ON GRAPH SET LOOKGRAPH PIEMULTI
ON GRAPH SET GRMERGE ADVANCED
ON GRAPH SET GRMULTIGRAPH 0
ON GRAPH SET GRLEGEND 0
ON GRAPH SET GRXAXIS 1
ON GRAPH SET GRAPHSTYLE *
setReportParsingErrors(false);
setSelectionEnableMove(false);
setDepthRadius(5);
setCurveFitEquationDisplay(false);
setDisplay(getDataText(0), false);
   .
   .
   .
setDisplay(getDataText(63), false);
setPieDepth(70);
setPieFeelerTextDisplay(1);
setPlace(true);
-*Autoshade
base on every 5 series setSeriesLooping(5);    setColorMode(4);
   setAutoColorLerpFactor(1);  -*
ENDSTYLE ON GRAPH SET STYLE * INCLUDE=IBFS:/CFG/FILE/IBI_HTML_DIR/javaassist/intl/EN/ENIADefault_combine.sty,$ ENDSTYLE END
On the output, the riser colors repeat after five car values because the looping index is 5:
You can automatically create a gradient color effect between the risers in a graph. You implement this type of coloring by setting the color mode to 5, setting a starting color for the gradient, and setting an ending color for the gradient:
setColorMode(5);
setAutoColorGradientStartColor({Color.start_color|new Color(r1,g1,b1)});;
setAutoColorGradientEndColor({Color.end_color|new Color(r2,g2,b2)});
where:
Implements automatic gradient riser shading.
Identifies the starting color for the gradient.
Is the code for the red, green, and blue components of the starting color.
Identifies the ending color for the gradient.
Is the code for the red, green, and blue components of the ending color.
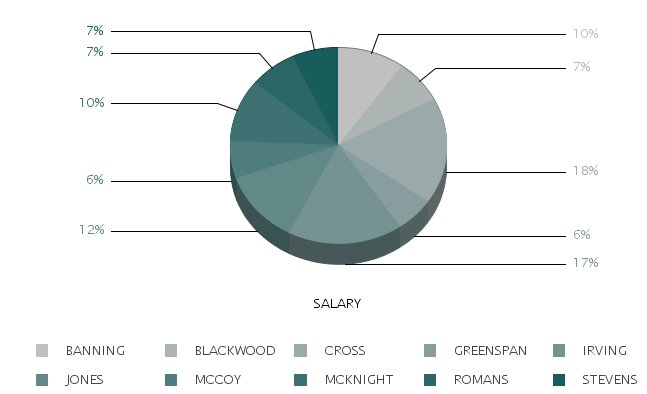
The following request implements automatic gradient riser coloring. It sets the color mode to 5, the start color to dark gray (192,192,192) and the end color to green (25,92,92):
-DEFAULTH &WF_STYLE_HEIGHT='405';
-DEFAULTH &WF_STYLE_WIDTH='770';
GRAPH FILE EMPLOYEE
-* Created by Info Assist for Graph
SUM EMPLOYEE.PAYINFO.SALARY
BY EMPLOYEE.EMPINFO.LAST_NAME
WHERE EMPLOYEE.EMPINFO.LAST_NAME NE 'SMITH';
ON GRAPH PCHOLD FORMAT PNG
ON GRAPH SET HTMLENCODE ON
ON GRAPH SET GRAPHDEFAULT OFF
ON GRAPH SET VZERO OFF
ON GRAPH SET HAXIS &WF_STYLE_WIDTH
ON GRAPH SET VAXIS &WF_STYLE_HEIGHT
ON GRAPH SET UNITS PIXELS
ON GRAPH SET LOOKGRAPH PIEMULTI
ON GRAPH SET GRMERGE ADVANCED
ON GRAPH SET GRMULTIGRAPH 0
ON GRAPH SET GRLEGEND 0
ON GRAPH SET GRXAXIS 1
ON GRAPH SET GRAPHSTYLE *
setReportParsingErrors(false);
setSelectionEnableMove(false);
setDepthRadius(5);
setCurveFitEquationDisplay(false);
setDisplay(getDataText(0), false);
   .
   .
   .
setDisplay(getDataText(63), false);
setPieDepth(70);
setPieFeelerTextDisplay(1);
setPlace(true);
-*Gradient
effect setColorMode(5);    setAutoColorGradientStartColor(new Color(192,192,192));
   setAutoColorGradientEndColor(new Color(25,92,92)); -*
ENDSTYLE ON GRAPH SET STYLE * INCLUDE=IBFS:/CFG/FILE/IBI_HTML_DIR/javaassist/intl/EN/ENIADefault_combine.sty,$ ENDSTYLE END
On the output, the riser colors form a gradient from the start color (dark gray) to the end color (green):
| WebFOCUS |