GRAPH FILE filename
graph commands
      .
      .
      .
ON GRAPH SET GRAPHSTYLE *
API call
      .
      .
      .
ENDSTYLE
[ON GRAPH SET STYLE *
WebFOCUS StyleSheet command
ENDSTYLE]
END
where:
- filename
-
Specifies a data source.
- graph commands
-
Are commands allowed in a procedure. For a description of valid commands, with syntax and examples, see Creating Reports With WebFOCUS Language in the Creating Reports With WebFOCUS Language manual.
- API call
-
Is a property setting, method call, or multiple property settings or method calls. For a description of property settings and method calls, with syntax and examples, see Properties, Methods, and Methods That Return an Object ID.
- WebFOCUS StyleSheet command
-
Is an optional WebFOCUS StyleSheet command or multiple StyleSheet commands. For a description of StyleSheet commands, with syntax and examples, see the Formatting Reports: An Overview chapter through the Formatting Report Data chapter in the Creating Reports With WebFOCUS Language manual.
The following annotated example illustrates how to customize a graph using four API calls. The API calls are highlighted in the request.
The calls illustrate the API syntax rules. They:
- Are case sensitive.
- End with a semicolon (;).
- Comply with explicitly defined spacing conventions.
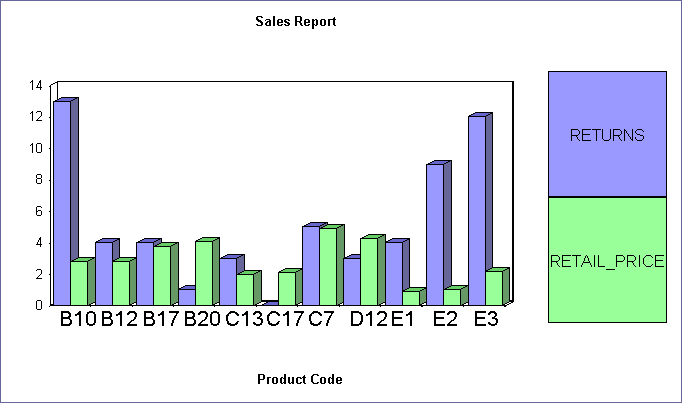
The procedure is
   GRAPH FILE SALES
   SUM RETURNS
   RETAIL_PRICE
   ACROSS PROD_CODE AS 'Product Code'
   ON GRAPH SET GRAPHSTYLE *
1. setLegendMarkerPosition(4);
2. setO1LabelRotate(0);
3. setTitleString("Sales Report");
4. setTextJustHoriz(getTitle(),1);
   ENDSTYLE
   END
where:
- Displays legend text inside the legend marker.
- Displays the X-axis labels horizontally.
- Displays the title Sales Report.
- Centers the title.
The output is: