In this section: |
You are now ready to begin row-by-row modeling of the income statement in the Financial Report Painter.
An income statement is made up of Revenue, Cost of Goods Sold, and Expenses.
Typically, it also calculates Gross Margin and Profit:
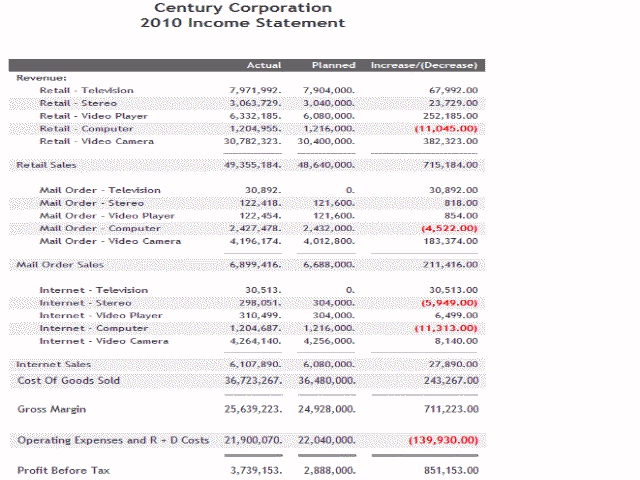
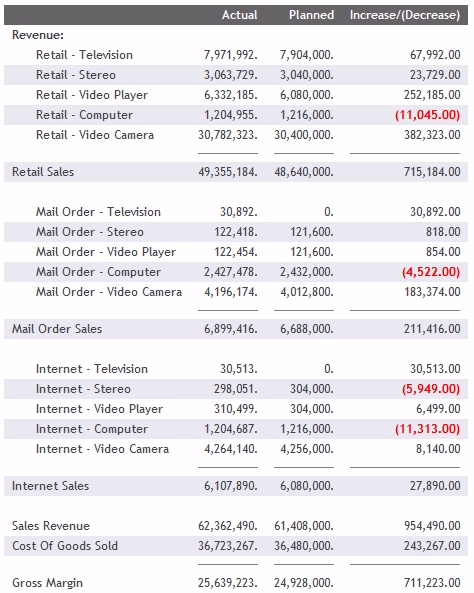
The following is the completed income statement you will be building. You may find it useful to refer to this output as you begin to replicate it in the following steps.
This changes the sorting mechanism for the ledger accounts field from one that sorts data by accounts in numeric order to one in which you can exercise row-by-row control of the account values. You will see the impact of this change in the rest of the tutorial.
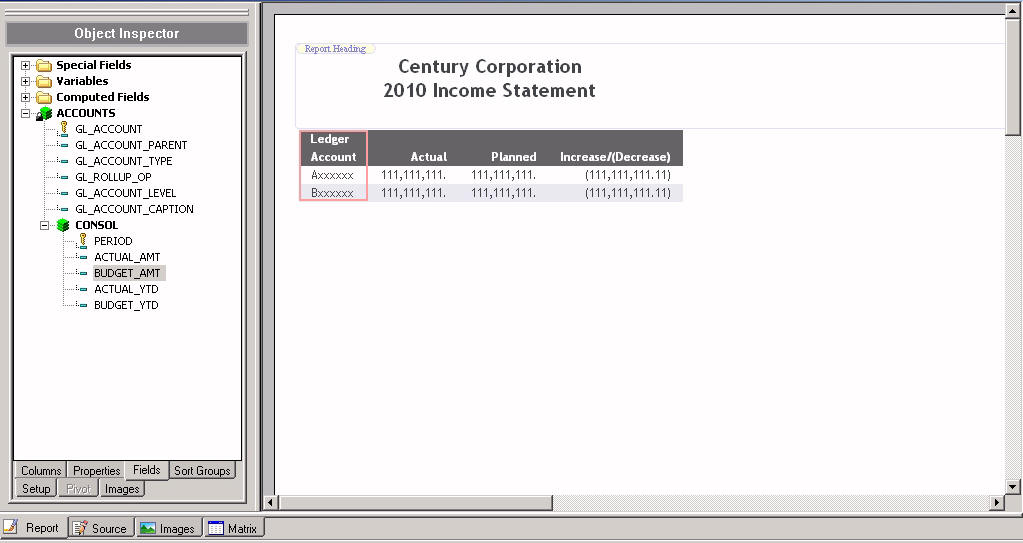
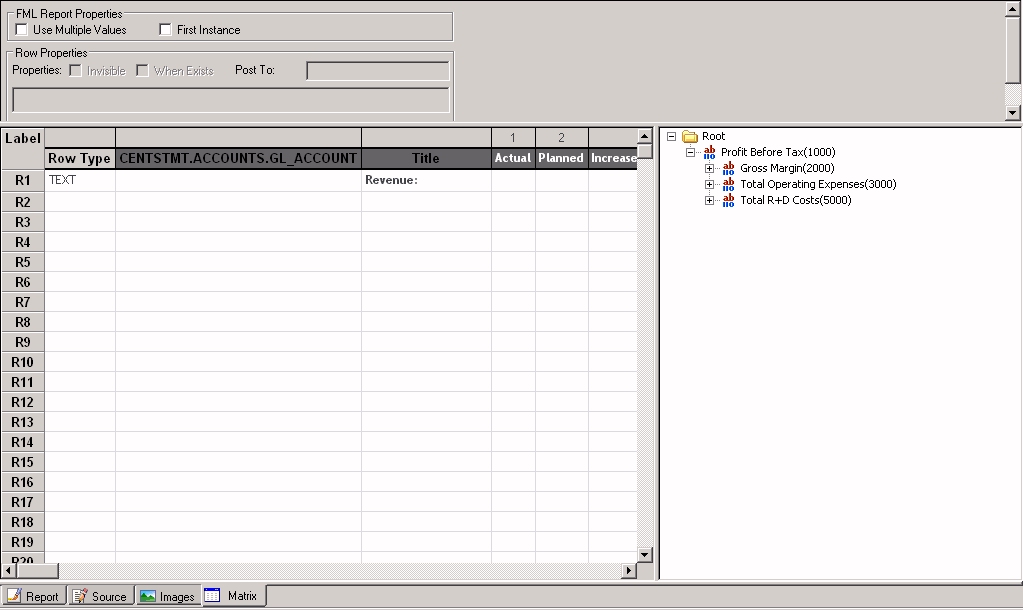
The Finanical Report Painter opens.
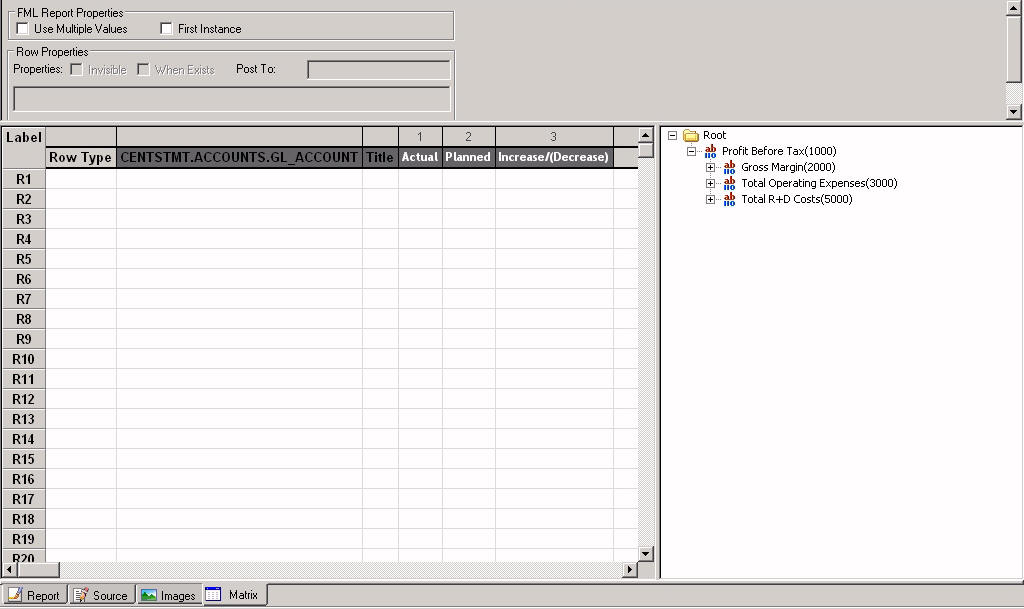
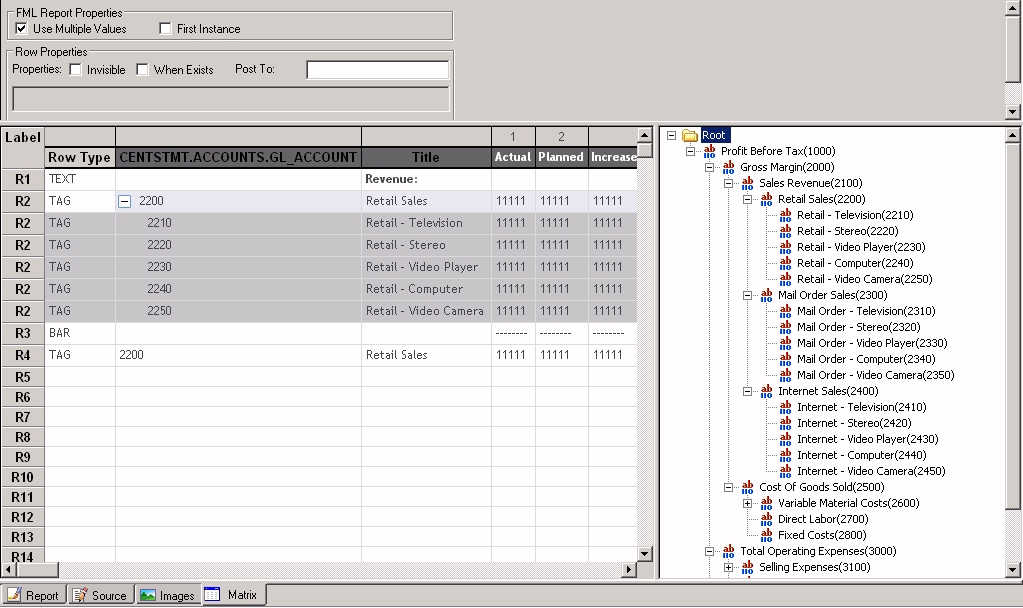
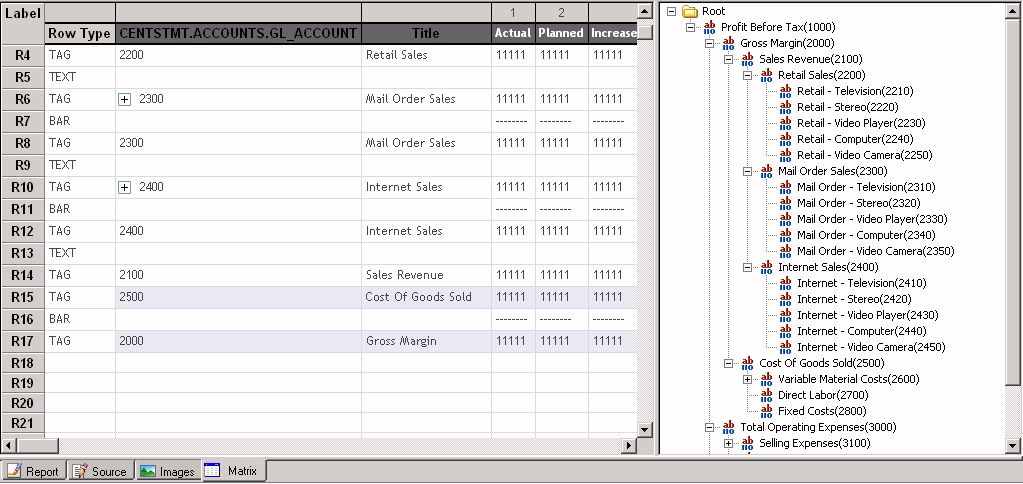
Matrix. At the left of the Financial Report Painter is the spreadsheet-like area that displays the columns you specified in the Report Painter, beginning with a column that will contain selected values of the For field, GL_ACCOUNT, followed by a column for the corresponding account titles. Although the report has no content at this point, each row is already identified by a default label (R1, R2 ...). You will populate these labeled rows. As you build the report, a row type will be associated with each row label.
For field values panel. At the right is a panel that displays the Chart of Accounts values for the GL_ACCOUNT field. These values are shown as a hierarchical tree, based on the parent/child relationships defined in the ACCOUNTS segment of the CENTSTMT Master File. (See Data Detour: What Is the Nature of the Data You Will Be Using?). The plus (+) signs indicate that you can open the hierarchy values further.
In this exercise, you will add selected data values of GL_ACCOUNT as rows in the income statement.
You will also add free text rows, blank rows, and rows that contain underlines to set off calculations.
The TEXT dialog box opens.
Revenue:
Revenue appears in the Title column on the matrix.
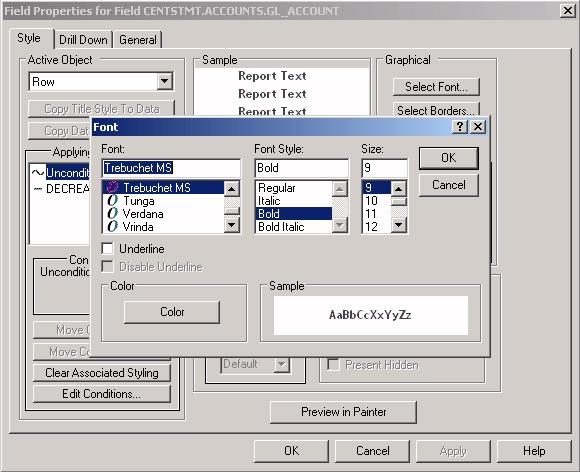
The Field Properties dialog box opens at the Style tab.
Notice that in the Financial Report Painter you can style rows and cells, as well as columns, whereas in the Report Painter you can only style columns.
The Font dialog box opens.
The matrix appears as follows. Notice that row R1 is identified as a TEXT row type, and Revenue is bold, as requested.
You are now going to begin to add data values from the Chart of Accounts. The first step is expanding a section of the hierarchy to expose the levels of values.
This value becomes red in the For field values panel to indicate that it has been used in the matrix.
Notice that TAG is entered in the Row Type column. Tags represent the data values of the For field.
The TAG dialog box opens.
Notice that Display children's caption is checked by default.
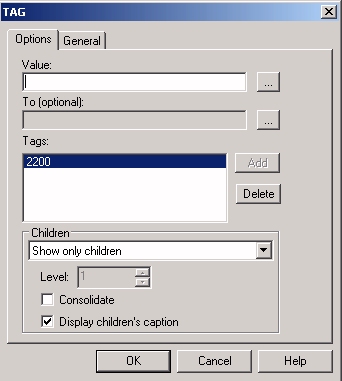
These selections indicate that you want to see values for the children of Retail Sales, (Retail - Television, Retail - Stereo, and so on), but not the value of Retail Sales itself.
In addition, the captions (descriptive titles) for the children will appear in the output in place of their tag values.
Notice that a plus (+) sign precedes 2200, indicating that it contains subordinate values that you can expand if you wish.
The BAR dialog box opens.
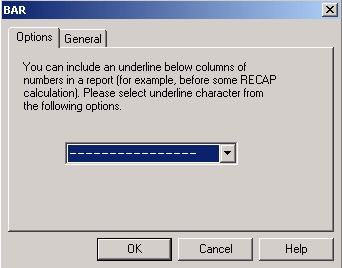
Remember that the ability to add an underline or a text row at any point in a report is an important distinguishing feature of a WebFOCUS financial report.
This matrix appears as follows, with the row R2 expanded to show its children.
The gray indicates that these rows are part of their parent and cannot be edited separately. Notice that they all have the same row label: R2.
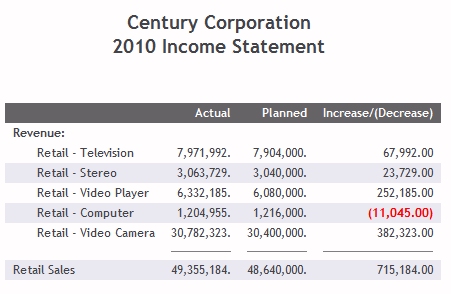
Notice that the descriptive captions are displayed rather than the account numbers. Notice also that retail revenue for computers is negative, showing lower than expected sales.
The TEXT dialog box opens.
The TAG dialog box opens.
The TAG dialog box opens.
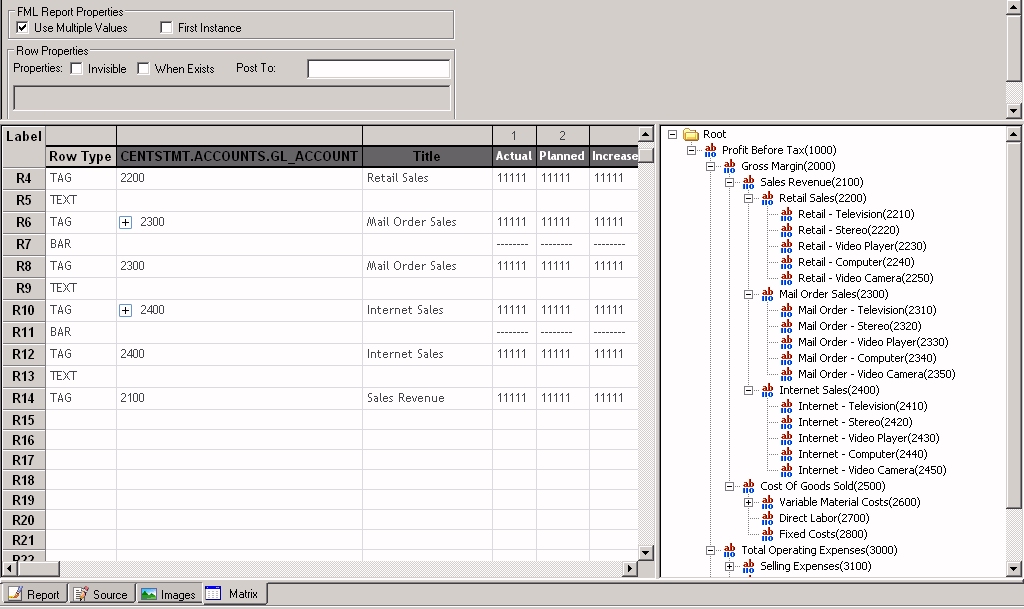
Once again, a blank TEXT row is automatically added in row R13.
The Financial Report Painter appears as shown in the following image.
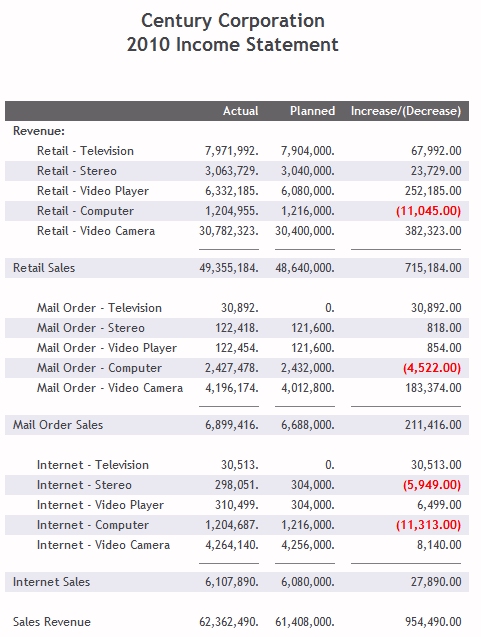
Notice that computer sales are below expectations in all revenue categories. You have completed the Revenue rows in the income statement.
Operating Expenses and R + D Costs
The 2010 Income Statement for Century Corporation appears as follows:
From the final income statement, Century Corp can attribute profits to sales success in various areas, as well as to success in keeping costs below budget in 2010. Now you can claim success in completing the Income Statement tutorial.
| WebFOCUS |