In this section: How to: Reference: |
This chapter discusses the Market Basket model.
What Is Market Basket Analysis?
Market Basket Analysis is a technique which identifies the strength of association between pairs of products purchased together and identify patterns of co-occurrence. A co-occurrence is when two or more things take place together.
Market Basket Analysis creates If-Then scenario rules, for example, if item A is purchased then item B is likely to be purchased. The rules are probabilistic in nature or, in other words, they are derived from the frequencies of co-occurrence in the observations. Frequency is the proportion of baskets that contain the items of interest. The rules can be used in pricing strategies, product placement, and various types of cross-selling strategies.
How Market Basket Analysis Works
In order to make it easier to understand, think of Market Basket Analysis in terms of shopping at a supermarket. Market Basket Analysis takes data at transaction level, which lists all items bought by a customer in a single purchase. The technique determines relationships of what products were purchased with which other product(s). These relationships are then used to build profiles containing If-Then rules of the items purchased.
The rules could be written as:
If {A} Then {B}The If part of the rule (the {A} above) is known as the antecedent and the THEN part of the rule is known as the consequent (the {B} above). The antecedent is the condition and the consequent is the result. The association rule has three measures that express the degree of confidence in the rule, Support, Confidence, and Lift.
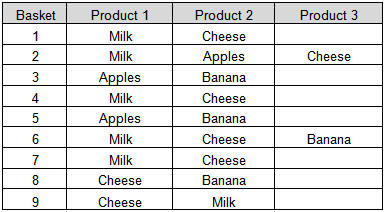
For example, you are in a supermarket to buy milk. Based on the analysis, are you more likely to buy apples or cheese in the same transaction than somebody who did not buy milk?
In the following table (table 1), there are nine baskets containing varying combinations of milk, cheese, apples, and bananas.
The next step is to determine the relationships and the rules. For explanation purposes, the following table shows some of the relationships. In total there are 22 rules for the nine baskets. The complete set of rules are shown in the explanation of the RStat output.
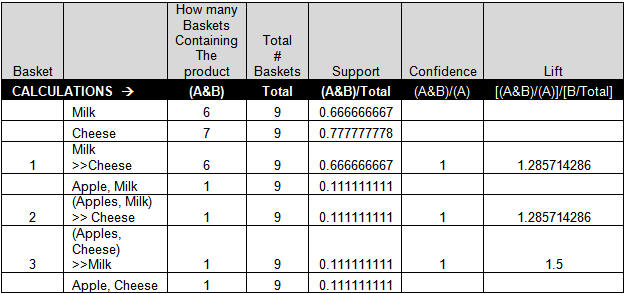
The first measure called the support is the number of transactions that include items in the {A} and {B} parts of the rule as a percentage of the total number of transactions. It is a measure of how frequently the collection of items occur together as a percentage of all transactions.
The support formula written out would look something like:
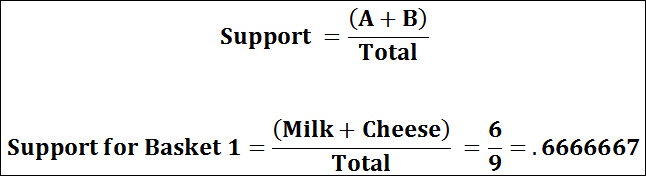
Interpreted as: Fraction of transactions that contain both A and B.
The second measure called the confidence of the rule is the ratio of the number of transactions that include all items in {B} as well as the number of transactions that include all items in {A} to the number of transactions that include all items in {A}.
The confidence formula written out would like something like:
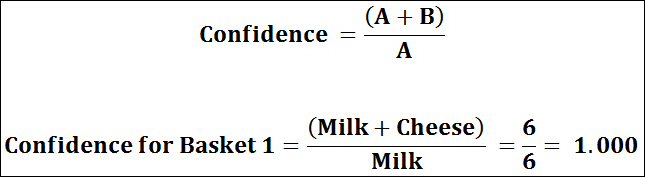
Interpreted as: How often items in B appear in transactions that contain A only.
The third measure called the lift or lift ratio is the ratio of confidence to expected confidence. Expected confidence is the confidence divided by the frequency of B. The Lift tells us how much better a rule is at predicting the result than just assuming the result in the first place. Greater lift values indicate stronger associations.
The lift formula written out would look something like:
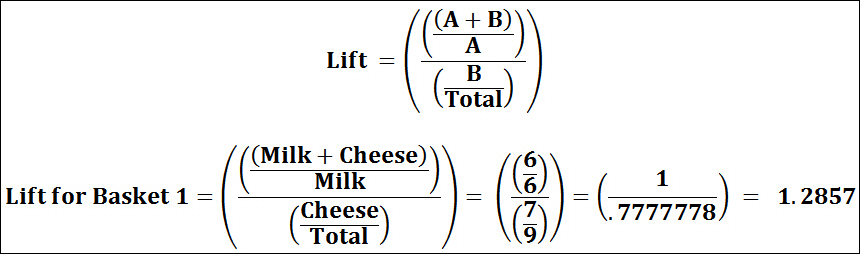
Interpreted as: How much our confidence has increased that B will be purchased given that A was purchased.
Practical Applications of Market Basket Analysis
When one hears Market Basket Analysis, one thinks of shopping carts and supermarket shoppers. It is important to realize that there are many other areas in which Market Basket Analysis can be applied. An example of Market Basket Analysis for a majority of Internet users is a list of potentially interesting products for Amazon. Amazon informs the customer that people who bought the item being purchased by them, also reviewed or bought another list of items. A list of applications of Market Basket Analysis in various industries is listed below:
For instance, Telecommunications these days is also offering TV and Internet. Creating bundles for purchases can be determined from an analysis of what customers purchase, thereby giving the company an idea of how to price the bundles. This analysis might also lead to determining the capacity requirements.
Data Requirement
For example, from the table 1 below:
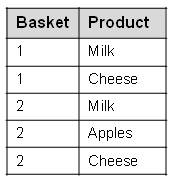
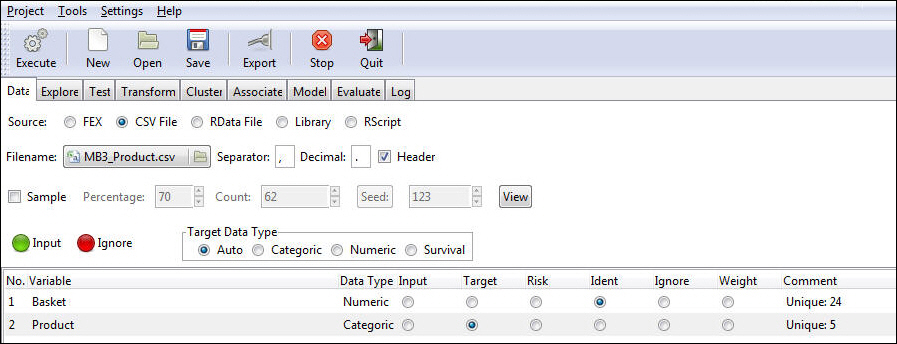
In this example, we are going to create a model for Market Basket Analysis of purchases at a grocery store. We will use the Basket data set that contains observations on the purchases of particular items, such as milk, cheese, and apples.
The Status bar confirms your data settings, as shown in the following image.
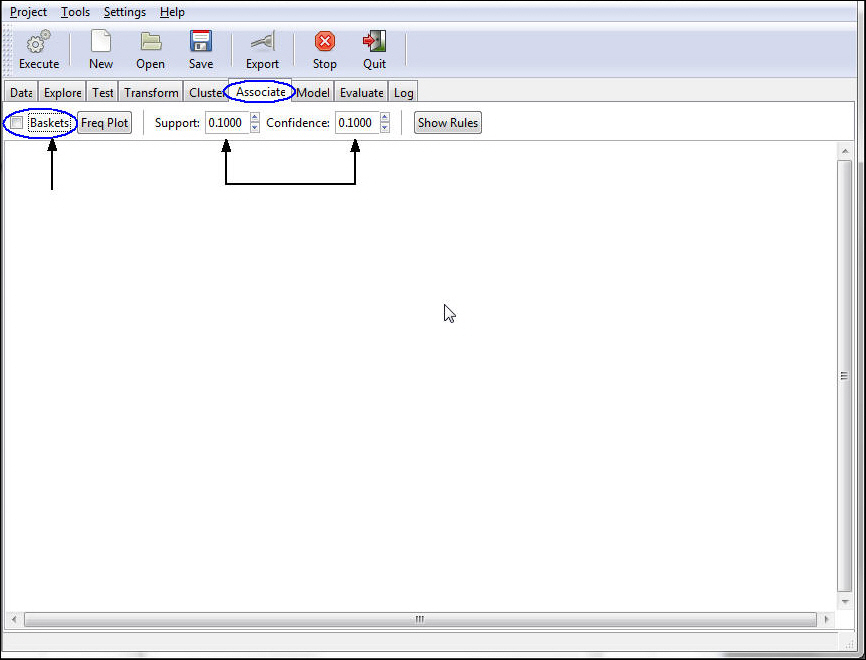
Note: Support is a numeric value for the minimal support of an item set (the default value is 0.1). Confidence is a numeric value for the minimal confidence of the rules or association hyperedges (the default value is 0.1).
The model output appears. You may need to scroll to see the complete output, depending on the size of your window.
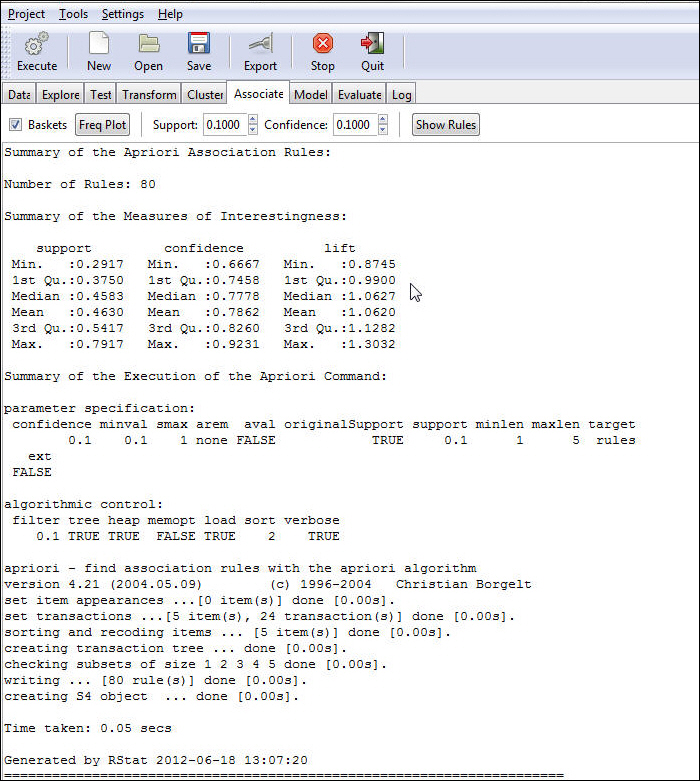
This is a summary of the settings that come with the apriori algorithm. Except for Support and Confidence, which you can change in the GUI, the remaining settings are set to default values.
parameter specification:
 confidence minival smax arem aval  originalSupport support minlen maxlen target  ext
.01 0.1 1 none FALSE TRUE 0.1 1 5 rules FALSEalgorithmic control: filter tree heap memopt load sort verbose 0.1 TRUE TRUE FALSE TRUE 2 TRUE
Note: For more information on the apriori algorithm parameters, see the R documentation for the arules package at: http://cran.r-project.org/web/packages/arules/arules.pdf.
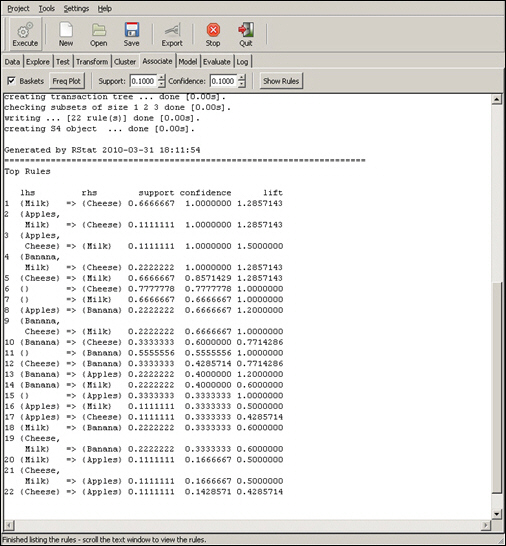
To generate rules, click the Show Rules button.
The output will be printed below the original information presented.
Note: Based on the data, the rules are created. For rule 1:
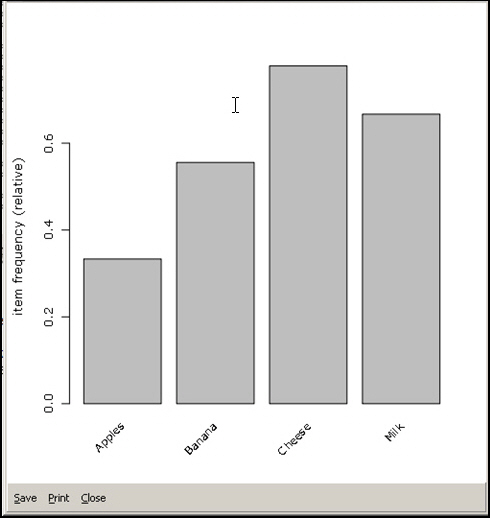
To generate a frequency plot, click the Freq Plot button. The output appears in a new window. This frequency plot shows the percent of times each unique item occurs in all baskets.
The bar chart below shows the frequency of the individual items in the analysis.
How to: |
In the example that is used in this chapter, the data set contains products that a customer in a grocery store might purchase (for example, milk, cheese, bananas, and apples). To run the Market Basket Analysis, the data set only needs to contain the basket and the product information. Once the Market Basket technique is run in RStat, a scoring routine can be exported, which would apply the output (rules with regard to the products and the confidence number) to the new data sets. This section provides procedures for the post-Market Basket Analysis execution process.
To execute the Market Basket Analysis:
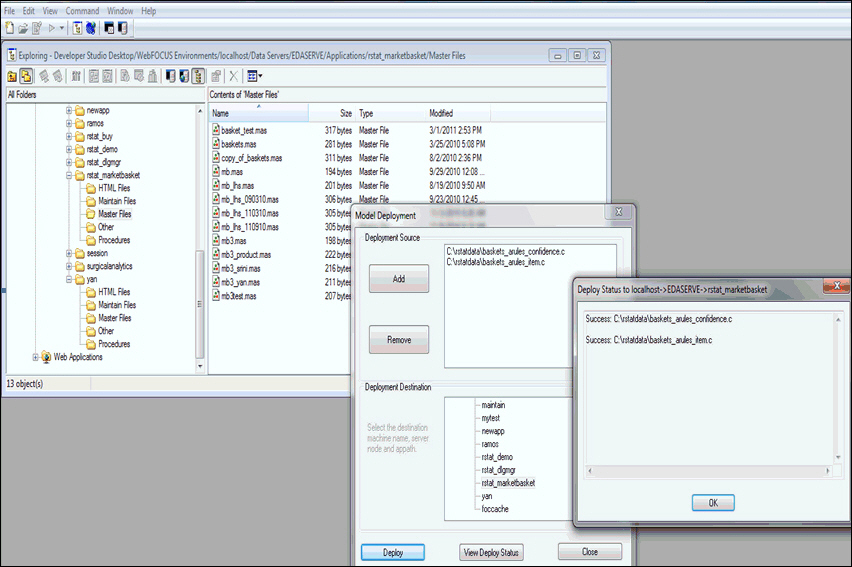
To export the Market Basket Analysis:
The Export C or PMML dialog box opens, as shown in the following image.
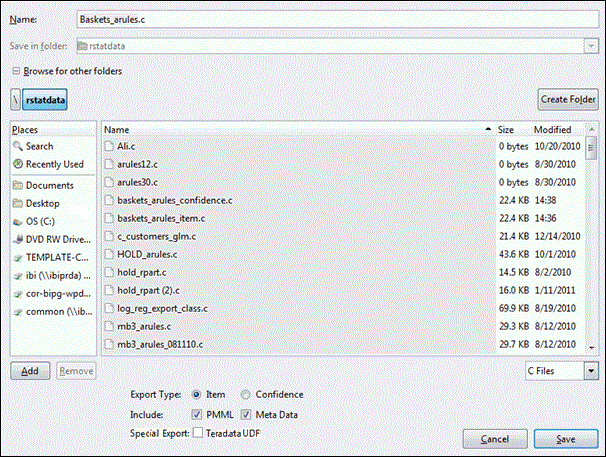
There are two export types that can be selected:
This will show the format and file structure for the scoring data set. The Max Inputs for the scoring file should be the total items in the training data set minus 1.
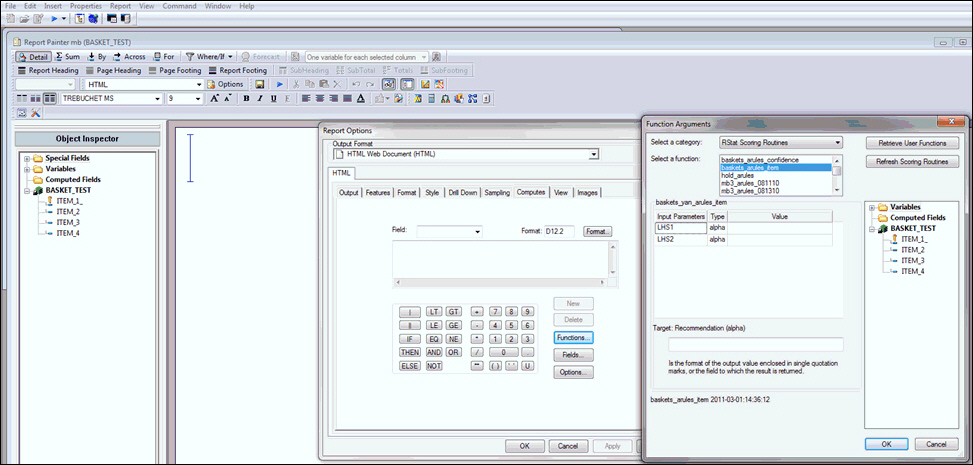
The following image shows the sample WebFOCUS reporting procedure.
The following image shows the output that is generated for the sample WebFOCUS report in a web browser.
The above report output lists the items and confidence value for each item to be selected. Values in the ITEM_2 and ITEM_3 columns are inputs. Values in the item and confidence columns are the results of the Market Basket Analysis routine. In other words, item is the product recommendation that the customer is most likely to buy after buying item 2 and item 3 together according to the associated rules generated by the historical data.
In the first case, item 2 is empty, so the suggested item is Milk for people who only purchase Cheese. In the second case, Beer is not within the historical data for generating the rules, so No match found is returned. This means that there is no product recommendation for people who purchase Beer. The result of the third case indicates that people who purchase Milk and Apples will also purchase Cheese. This is followed by a confidence value that shows the possibility of buying Cheese after purchasing Milk and Apples together.
| WebFOCUS |