-
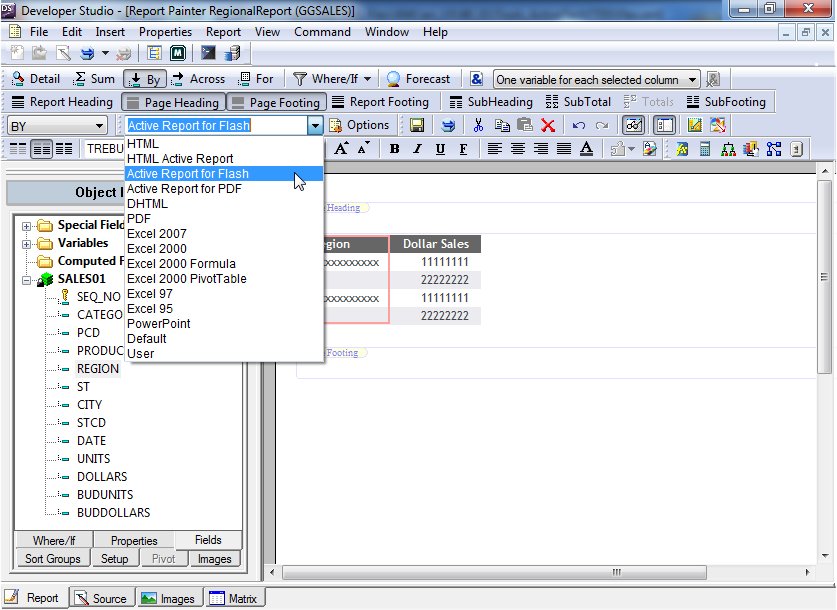
Create an
active report with an output format of either active report for
Adobe Flash Player (FLEX) or active report for PDF (APDF). In the
following image, active report for Flash is selected from the output
format drop-down list on the Report Painter toolbar.
- Run the active report.
-
In any column
heading, click an arrow to display a drop-down menu. From the menu,
click Pivot Tool, as shown in the following image.
The Pivot Tool opens, as shown in the following image.
-
Left-click
and drag the desired columns into the Group By, Across, and Measure
sort fields.
You must include a column in the Group By and Measure sort fields (a Measure typically defines how much or how many). The Across sort field is optional.
In the following example, Product and Category are the Group By sort fields, Region is the Across sort field, and Dollar Sales is the Measure field.
-
You can
edit the sort fields by clicking the X icon
to delete columns, drag multiple columns into the Group By or Across
sort fields, reorder the columns in the sort fields, and change
the aggregation type of the Measure by clicking the Calculation
 icon.
icon.
You cannot use multiple Measures.
-
The Pivot
Table is generated in a new window based on the sort fields selected,
as shown in the following image.
- Click the close button, X, in the upper-right corner of the Pivot Tool to exit the tool.
-
You can
click the Menu icon on the Pivot Table toolbar,
and click Pivot Tool, to open the Pivot Tool again.
On the Pivot Table toolbar, you can optionally lock (freeze) the table by clicking the Lock
 icon,
or change the aggregation type by clicking the Calculation
icon.
icon,
or change the aggregation type by clicking the Calculation
icon.