PMF rolls up and drills down to metrics along dimensions. Separately, scorecards have a cascading hierarchy. Any PMF implementation can match the scorecard cascading hierarchy to the metrics dimension hierarchy one-to-one, or use a separate scheme.
A metrics pool is common across all scorecards. It can be as big a pool as you need, with as many metrics as you need. Each of these metrics is hierarchical. The hierarchies go to 16 levels deep, with each level allowing as many individual members as you need. In other scorecard models, profit for the east is a separate metric from profit for the west, so there are several requirements for rolling up values. In the PMF scorecard model, a single profit metric exists while there are details for the east and west, which easily roll up because they are associated with the same metric.
The metrics which a user is permitted to see in the hierarchy depend on the user ID. With PMF you can map each user ID to a level in the metric hierarchy. For example, if you have a hierarchy (dimension) that matches your corporate organization, you can secure sensitive metrics and make metrics specific to users using the organization chart. Individuals in the organization can see the aggregation and detail of the metrics that apply to them, but cannot see the ones that do not apply to them.
Each user has a default scorecard and can see all shared scorecards. On a scorecard, objectives can be links to one or more metrics in the metrics pool. Metrics are associated with a scorecard because they are linked to an objective. You can link zero metrics, one metric, or more than one metric to any objective. If you link more than one metric, you can weigh the share each one has in the overall performance of the objective.
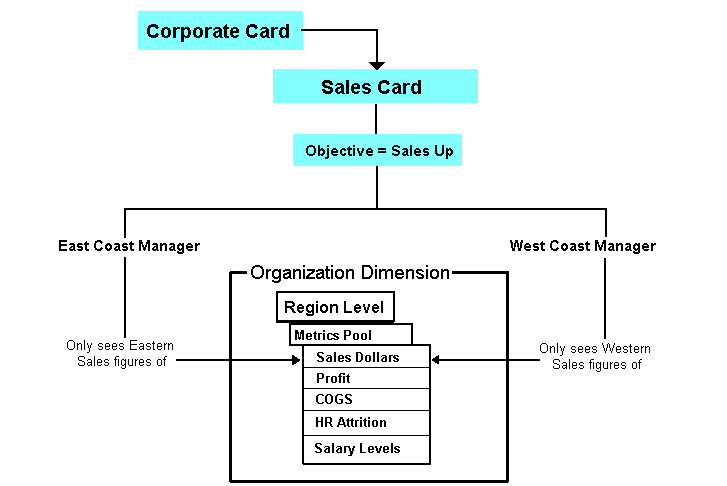
Assume Mr. East is the sales manager for the east coast. He can see sales dollars, profit, COGS, Human Resources (HR) attrition, and salary levels for the east coast. He can also see quality metrics, organization service levels, stock levels, returns, and re-purchases for all the national and international locations. When he looks at his Sales Card, which is cascaded from the Corporate Card, and the card has objectives that link to these metrics, he can see them. For example, there is a Sales Up objective (goal), and it is linked to the sales dollars metric. Mr. East can see the sales dollars metric for the east coast through the Sales Up objective.
Now assume that Mr. West is the sales manager for the west coast. He can see the filtered metrics for the west. He has the same Sales Card as Mr. East. When Mr. West looks at the Sales Up objective on that card, it shows sales dollars for the west. Mr. East and Mr. West are using the same card, but have different access to the metric hierarchy.
This PMF model is illustrated in the diagram that follows.

Why the same card? Because typically cards do not map to people; rather they map to roles in the organization. Our organization has more than one regional sales manager and they all carry out the same strategy. It has many sales people under those managers and they each carry out the same strategy as agreed on by management. Having a separate scorecard for each person is high maintenance. Having shared scorecards reduces the cost of ownership.
PMF is not limited to the model described. Each person can have a separate scorecard. The scorecards will still cascade, and each person can use any of the pooled metrics associated with their cards.
You do not have to use a dimension, such as Organization to organize metrics. You can control access to the up-to-16 metric hierarchies any way you want. However, to match scorecards (which typically cascade by function in the organization) to metrics, use an organization chart type of dimension because it is common between the way you cascade cards and the way you grant access to the hierarchy of metrics.
The PMF model is simple and easy to maintain. For example, suppose you have a franchise business. Every business unit is a shop or store, and all of them have the same business strategy. Only one scorecard is required, and business performance is managed through a pool of identical types of metrics across each store. Each store sees only its part of the metrics pool. If you did not use this model, you would need to maintain and update a separate but identical scorecard for each store, and a separate but identical set of metrics for them, too. If you had thousands of stores, such a system would be very expensive to maintain.