In this section: |
|
The following new features apply to InfoAssist reports, charts, and documents.
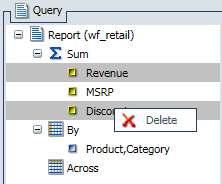
In the Query Design pane, you can select and delete multiple data fields at one time. Press the Ctrl key, select two or more data fields, right-click, and then click Delete, as shown in the following image.
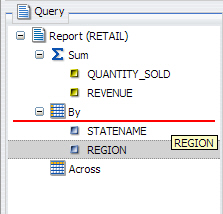
As of Release 8.0 Version 09, when working with fields in the Query Design Pane, you can drag fields to rearrange the order in which they display in your report or chart. When you drag a field to a different location, an indicator line displays, as shown in the following image. This line provides guidance as to where the field will be placed.
As of Release 8.0 Version 08, the PowerPoint 2007 format is available in InfoAssist. To enable this functionality, access the WebFOCUS Administration Console. Under Utilities, select InfoAssist Properties. Navigate to the Format tab section and select the PowerPoint 2007 format. For more information on PPTX syntax, see Using PowerPoint PPTX Display Format.
As of Release 8.0 Version 07, you can use new drill-down functionality, which allows one report or chart to filter another report or chart in the BI Portal. You can also use Optional Where clauses to enable reports and charts to accept the filter.
You can use this procedure to create a drill down in your report.
-
Create a
report, as shown in the following image.
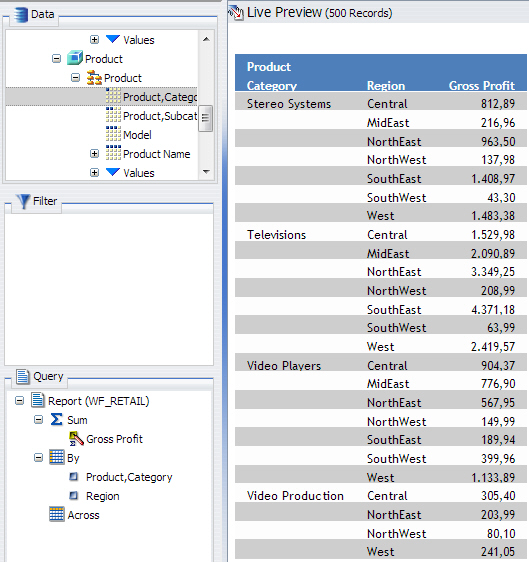
- Select a field, for example, Region.
-
On the Field
tab, in the Links group, click Hyperlink.
The Drill Down dialog box displays.
- Select the Refresh BI Portal radio button.
-
Add a drill down on the Region field, as shown in the
following image.
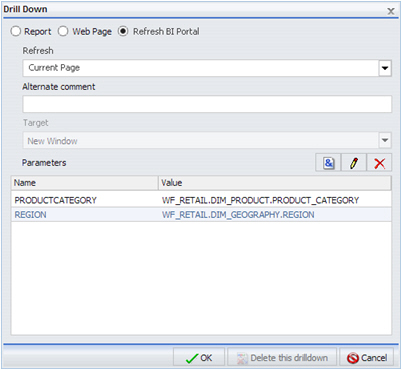
- Click OK.
You can use this procedure to build a report that will get filtered.
-
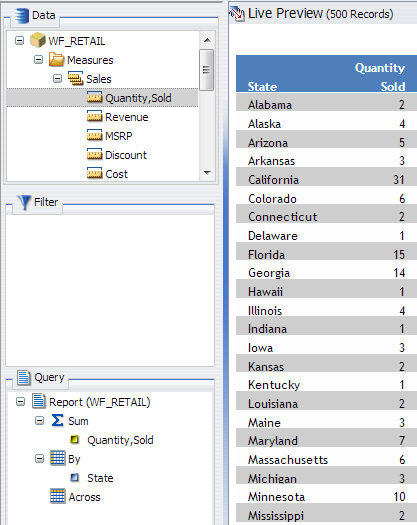
Create a report using two or more components, one of which will
be filtered. For example, using the data elements State and Quantity
Sold, as shown in the following image, you can define related filters.
-
On the Data
Tab, in the Filter Group, select Advanced Filter.
The Advanced Filter dialog box opens.
- Select a field for which to define a Where clause.
- Select a comparison operator, for example, Equal to.
- Click Value to enable a drop-down list.
- Select Parameter.
-
Click the Optional radio
button, as shown in the following image, to define this Optional
Where clause.
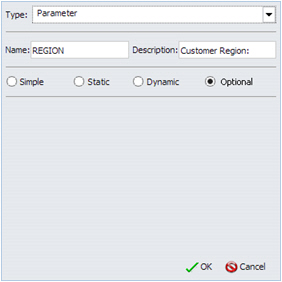
Note: An Optional Where clause is added for both Product Category and Region.
- Click OK to close the Parameter dialog box.
- Click OK to close the Create a filtering condition dialog box.
As of Release 8.0 Version 05, Lightweight Mapping functionality has been added to the InfoAssist charting options. The Lightweight Mapping functionality enables you to display your underlying data regionally. Using the Geographic Information System (GIS) capabilities that are built into WebFOCUS 8, the map functionality converts data values into maps that can be used for visualizing patterns or trends. More specifically, data that is bound to a geo-location, such as State, Country, and ZIP Code, can be viewed as symbol layers integrated into a powerful map viewer. The mapping functionality supports a variety of popular formats, such as bubble markers and heat-filled polygons (also known as Choropleths). These map formats are described below.
- Choropleth. A geographically-based heat map. It is useful for visualizing location-based data, trends, and distributions across a geographic area.
- Proportional Symbol (Bubble). A technique that uses symbols of different sizes to represent data associated with different areas or locations within the map.
The following image illustrates one of the types of maps that can be generated.
The WebFOCUS mapping architecture features an HTML5 map viewer with zoom, pan, and scale controls. It also includes a mapping server with nine levels of zoom.
Like all HTML5 visualizations, the highlighted markers and regions on the maps support drill, multi-drill, and informational ToolTips.
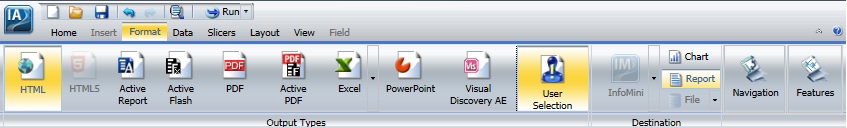
As of Release 8.0 Version 05, you can select the User Selection output type to change the output type of your report at run time. This functionality is accessible in the Output Types group on the Format tab, as shown in the following image.
At report run time, an output type prompt is automatically generated,
as shown in the following image.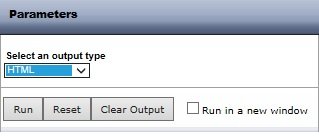
You can select one of the following output types for your report, chart, document, or dashboard:
- For reports, you can select HTML, active report, active Flash, PDF, active PDF, Excel 2000, Excel 2007, Excel Formula, and PowerPoint.
- For charts, you can select HTML, HTML5, active report, active Flash, PDF, active PDF, Excel 2000, and PowerPoint.
- For documents and dashboards, you can select HTML, active report, active Flash, PDF, active PDF, Excel 2000, and PowerPoint.
As of Release 8.0 Version 04, new aggregation functionality is available in InfoAssist. Within functionality allows you to use specific aggregation tasks at different report levels. You can use the Within phrase to manipulate display field values as they are aggregated within a sort group, rather than a report column.
In the following image, the output on the left shows the percentage distribution for the entire column, whereas the output on the right shows aggregation within a region.
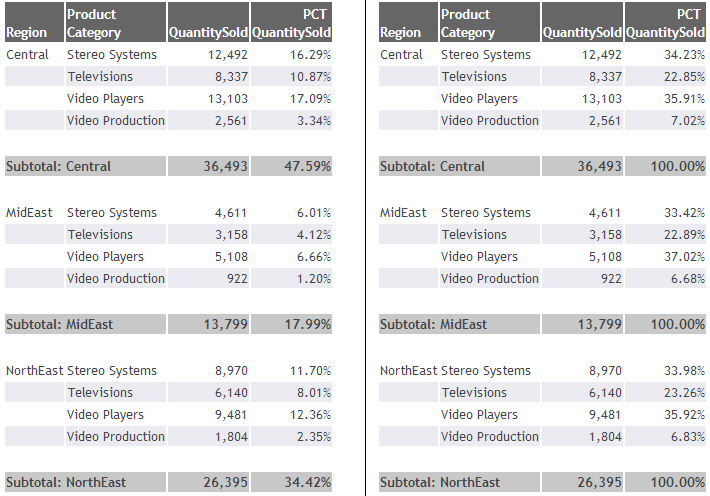
Note: You can have a maximum of two Within phrases. The first applies to By fields and the second applies to Across fields.
-
With a report
open, in the Query Design pane, select the numeric measure data
source field.
The Field tab appears on the ribbon.
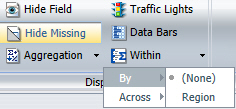
-
On the Field tab, in the Display group, click Within,
as shown in the following image.

Note: Depending on how your data is set up, you can apply the Within phrase on a By or Across field.
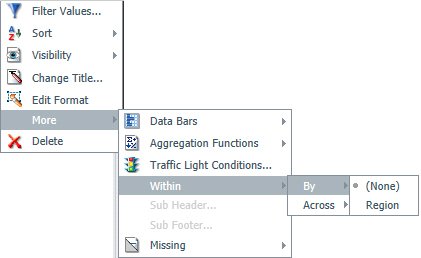
Optionally, you can access the Within functionality from the right-click menus on the column level, as shown in the following image. You can also access these menus when you right-click on an operator (for example, SUM) in the Query pane.
-
On the Within
menu, click the down arrow to select the Within phrase for the By
or Across field, as shown in the following image.
- Select a By or Across field from the list of available fields.
- Run the report to view output.
Note: As of WebFOCUS Release 8.0 Version 02, subquery filter functionality is available in InfoAssist.
HOLD files are a mechanism for storing temporary output files on the WebFOCUS Reporting Server. The life span of these files can range from very transient, such as files saved in the EDATEMP directory of a reporting agent for use in the same procedure (FEX), to longer lasting files containing precalculated or presummarized data that may be run nightly and used throughout the following day.
HOLD files are required for various reports and constructs. One such use is when a developer requires specific sort fields in a report and they are in a multi-path structure. The developer may create a HOLD file to drop the multi-path structure and then report off the HOLD file to get the desired report. HOLD files can be created to use in a report, chart, document, or dashboard.
In InfoAssist, you can create a subquery using a HOLD file. A subquery is a nested query, which is added to the Where clause of an SQL statement. A subquery is valuable because it is reusable.
For more information on subquery filters using a HOLD file, see the InfoAssist User’s Manual.
InfoAssist Basic is a modern, web-based facility that provides comparable functionality to legacy reporting tools. InfoAssist Basic contains many of the features of InfoAssist, while still allowing you to create and edit reports and charts as you would with a legacy tool.
You can click the Accessibility button, in the Format tab, to add a title to a report, chart, or document that is Section 508 compliant. This option is only available for reports and charts when the output type is HTML or PDF. For documents, the output type must be set to PDF.
In the Business Intelligence Portal, accessibility mode is on by default for Section 508 users. Non-Section 508 users must click the Accessibility On link in the BI Portal banner to enable accessibility. The Accessibility button is shown in the following image.

You can add new conditional styling or modify existing conditional styling by applying traffic light colors to a selected field in the output when the field meets specific criteria. You can also create drilldowns for conditions. The Traffic Lights button, in the Display group under the Field tab, opens the Traffic Light Condition dialog box. For more information related to reports, see How to Apply Traffic Light Conditional Styling to Data in a Report in the WebFOCUS InfoAssist User’s Manual. For more information related to charts, see How to Apply Traffic Light Conditional Styling to a Chart in the WebFOCUS InfoAssist User’s Manual.
The Missing Data menu enables you to control the display of missing data values in a chart. The Display group, under the Data tab, provides access to the Missing Data menu, as shown in the following image.

When you select the Missing Data button, a drop-down menu appears, as shown in the following image.
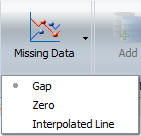
When you select Gap and you are using a bar, line, or area chart, missing values appear as a gap in the chart.
When you select Zero and you are using a bar chart, a bar appears on the zero line. If you are using a line chart, a solid line connects the missing value with the succeeding value. For an area chart, the area appears on the zero line.
When you select Interpolated Line and you are using a line graph, missing values will appear as an interpolated dotted line that connects the plot points preceding and succeeding the missing value. When using bar or area graphs, missing values will display as an interpolated bar or area chart.

 .
.