Developer
Studio offers a selection
of graphical development tools for building web-based reporting
applications. These tools can be accessed from the Projects on localhost folder for
local development and deployment to the web. A subset of the tools
can also be accessed from the WebFOCUS Environments
folder for development or editing directly on the Reporting Server
and the web server.
Note: When naming applications,
spaces and special characters are not allowed. For example:
! @ # $ % ^ & * ( ) + =
Below are
some of the tasks and tools that you can use in Developer Studio.
Creating your local
project
The Project Wizard, which
you can access only from the Projects area, creates an application
control file and defines search paths for additional project resources.
For more information, see Project Wizard.
Creating data source descriptions
Use one or more of the following:
-
Synonym Editor. Provides
a graphical interface that enables you to view and modify existing
synonyms. For more information, see Synonym Editor.
-
Create Synonym
Tool. Creates synonyms on the Reporting Server if they do not
already exist. For more information, see Create Synonym Tool.
You can also create synonyms using the
Server Console. For details, see the Describing Data With Graphical Tools manual.
-
Synonym Wizard. Creates synonyms
for a z/OS platform.
For details, see the Describing Data With Graphical Tools manual.
-
Upload
Data File Utility. Allows you to create a WebFOCUS Master File
and data file from a local file, such as Excel or CSV file and continue
to create reports using WebFOCUS reporting tools.
Building report procedures
Use
one or more of the following:
Creating launch pages
Developer Studio creates launch pages that prompt for values.
HTML
Composer. Creates reporting procedures and highly refined HTML
pages from which the procedures can be run, in a single process.
For more information, see HTML Composer.
Performing iterative OLAP analysis
Use the following:
-
OLAP Control
Panel. Manipulates multi-dimensional data for analysis.
-
OLAP Selections
Panel. Provides quicker ad hoc data selection, graph transformation,
and drill downs on measures. For more information, see OLAP Graphical Tools.
Deploying projects
to the web
Deploy Wizard. Partitions
and copies files to the specified Reporting Server and web server.
You can only access this option from the Projects folder. For more information,
see Deploy Wizard.
Coding project components
Use the following:
-
Text Editor. Enables
you to create, view, and edit source code for procedures, Master
and Access files, and other types of project files. This tool is especially
useful for writing code that does not have a corresponding graphical
tool, such as Dialogue Manager code. For more information, see Text Editor.
-
SQL Editor. Allows
you to code SQL passthru and highlights any SQL commands within
the code. For more information, see SQL Editor.
Managing your environment
Use one of
more of the following:
-
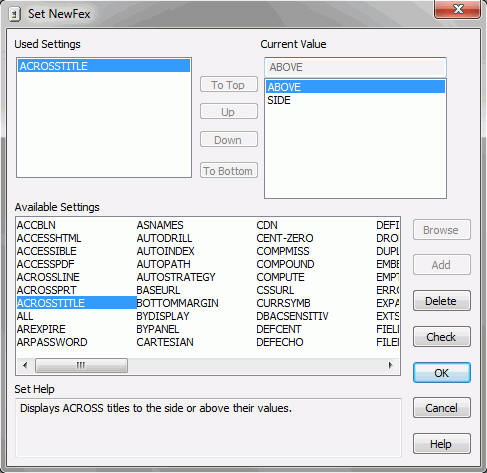
Set Tool. Resets parameters to
change aspects of WebFOCUS default behavior that affect both the
local development and deployment environments. For more information,
see Set Tool.
-
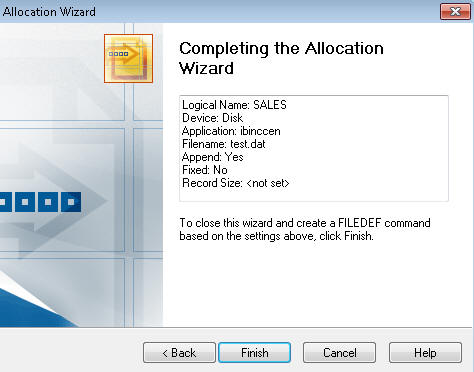
Allocation Wizard. Assigns temporary
names and storage locations to files created and used by WebFOCUS.
For more information, see Allocation Wizard.
-
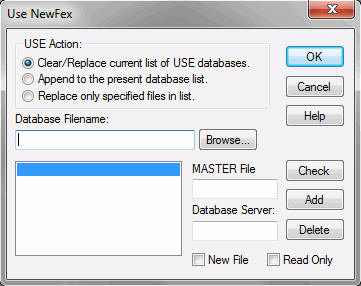
Use Tool. Identifies a FOCUS data
source. For more information, see USE Tool.
-
Impact Analysis. Analyzes
Master Files and fields and determine if they are used in WebFOCUS procedures. For more information, see Impact Analysis.
Managing communication with the server
-
Command
Console. Enables you to issue commands to a Reporting Server.
For more information, see Command Console.
-
Reporting
Server Console. Remotely manages your Reporting Server environment.
You can view server and agent status and statistics and manage agent
connections. For more information, see Reporting Server Console.
x
The Project Wizard enables you to
name the project, designate a directory for it, and optionally add
other directory paths to data sources from which the project can
retrieve information, or paths to other resources.
Note: Projects directories are
created in lowercase.
When you have completed the Project Wizard, the new project is
added as a node in the Explorer under Projects on localhost.
For details about this tool, see Creating a Reporting Application in the Creating
Reporting Applications With Developer Studio manual.
x
The Synonym Editor enables you to view and edit existing
synonyms. This tool generates the data description language required
to read the data.
The Synonym Editor supports hierarchical
data and the Financial Report Painter uses this data to create a
tree hierarchy.
For details about the Synonym Editor, see Using the Synonym Editor in the Describing
Data With Graphical Tools manual.
For more information about the Financial
Report Painter, see Creating Reports With Financial Report Painter in
the Creating Financial Reports manual.
x
Whether you are developing
projects in the local server environment (the Projects on localhost
area), or running procedures from the Data Servers area under WebFOCUS Environments, you will need to ensure that the Reporting
Server has the data source descriptions or synonyms it requires
to locate and interpret your data sources. You can create synonyms
using the Create Synonym tool.
You must configure a data adapter before you can create a synonym.
You may configure adapters with the Create Synonym Tool.
For details about the Synonym Editor, see Using the Synonym Editor in the Describing
Data With Graphical Tools manual.
For details about this tool, see Accessing Data and Creating Synonyms in the Describing
Data With Graphical Tools manual.
x
For z/OS platforms, the Synonym Wizard is used to create
synonyms when reporting against other remote servers (or subservers)
that are configured on the target server. You can also create synonyms
against DB2, the only relational data source supported on MVS.
You can use the Synonym Wizard to create a synonym for a data
source on the Reporting Server, based on the native schema that
resides with the data. If the remote server is configured as a subserver
to a hub server, the Synonym Wizard can generate a synonym on the
hub server, including an Access File that identifies the location
of the data on the subserver.
The Synonym Wizard guides you through the creation process for
one or more synonyms. The synonyms are created on the Reporting
Server in the current application. The new synonym appears in the
Master Files folder from which the wizard is launched.
Note: For data sources, Web Query uses the original Master
Files stored on the server, therefore no synonyms are required.
The wizard consists of panels beginning with one shown below,
where you select the relational data source you want to generate
a synonym for.
xComponent Connector Toolbar
The Component Connector menu, which appears in the Procedure
window, enables you to create components that make a procedure executable.
A Comment component is displayed by default. A procedure can include
one or a combination of components, as illustrated in the following
window.
Open the Component Connector toolbox by clicking one of the yellow
diamonds.
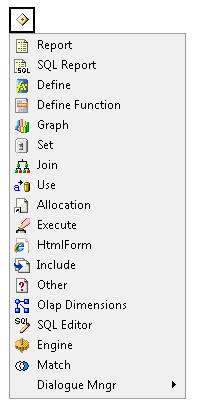
As you add components, the Procedure window displays an icon
that represents the component. Each icon on the Component Connector
toolbar launches either a graphical tool or the text editor.
You can check components in order to locate errors. Each component
tool includes a Check button that checks the syntax of the code
against the server.
The options available in the Component Connector menu are also
available in the Task Viewer toolbar and in the Insert menu.
For details about this tool, see Creating a Reporting Procedure in the Creating
Reporting Applications With Developer Studio manual.
x
Report Painter provides a graphical representation of
the report you are creating.
Report Painter offers great flexibility in how you can:
- Display and
sort data.
- Select records.
- Include totals,
subtotals, column calculations, heading, footings, and images.
- Format columns.
- Style fonts,
colors, and grids.
- Add drill-downs
to detailed reports and URLs.
- Save output
in many types of formats for display and reuse.
For details about these and many other
features, see the Creating Reports With Report Painter manual.
The following list highlights features
that extend your reporting capabilities:
-
Formatting
and styling capabilities. You can:
- Drag the column
border to the desired width.
- Add a border
to an entire report, a column, or any object area (for example, Page
Heading, Page Footing, Subheading, Subfooting). You can add borders
in a variety of line styles, widths, and colors.
- Style the background
color for an entire report, including all column titles and all
data components. You can also specify a background color for individual columns
and alternating rows.
- Apply a page
color. The report on the page inherits the page color.
- Insert the
current page number and total page count for a report as embedded fields
in a report heading or footing.
- Insert a spot
marker. A spot marker divides text in a heading or footing into separate
items. You can then individually position and style these items.
- Align decimal
points. You can align decimal points when the displayed data has a
varying number of decimal places.
- Insert the
current date. You can insert the current date as an embedded field in
any object area (for example, Page Heading, Page Footing, Subheading, Subfooting)
in Report Painter. Once the date is inserted, you can justify, position, and
change the font of the date field.
You can also specify the date
format and a display format for the time.
For
more information, see Creating a Calculated Value With Report Painter in
the Creating Reports With Report Painter manual.
- Select a column
component (Title, Data, or Title and Data) and apply styling options
(font and font color, grid, border, or background color), using
the Style tab on the Field Properties dialog box. In addition, you
can create a condition and apply to it any style available on the
Style tab.
- Copy an existing
drill-down component to a column component, using the Drill Down
tab on the Field Properties dialog box. You can also open a child
report from this tab for viewing or modification in a new instance
of Report Painter.
- Remove an underline
from a column title on a report, using the General tab on the Field
Properties dialog box.
- Enter replacement
text using the Features tab. The Features tab on the Report Options
dialog box features a Report Title input field. The text you enter
into this input field replaces the default text in the Internet
Explorer title bar when you run the report in HTML format.
For
Excel report formats, you can enter a worksheet title in the Customize worksheet
title input field of the Format tab. The text in the Customize worksheet
title input field replaces the default Worksheet tab text in Excel
2000.
- Report Painter
enables you to create and style complex reports. You can graphically paint
the report on the Report Painter window, which is a graphical representation
of the report page. The graphical view provides a close approximation
of how the report will display at runtime. To get a more WYSIWYG
view, use the SET SQUEEZE=OFF command in your report or pin all
of the columns of the report. For more information on setting these
options, see WebFOCUS Creating Reports With Report Painter
Version 7 Release 7.
-
Graphical
User Interface (GUI). You can align embedded fields in object
areas (Page Heading, Page Footing, Subheading, Subfooting) with
report columns.
Note: This feature is available only for
HTML reports.
You can:
- Copy style
characteristics from one column to other columns by using the Match
All Styles button on the Font toolbar. You can copy font, grid,
background color, conditional styling, or all of these characteristics.
- Launch procedure
components from the Setup toolbar in Report Painter. The Setup toolbar
lists the components that precede the report component. Click the component
to access the appropriate tool (Define, Join, or Dimension).
- View the Master
File structure (segments or fields) from the Fields tab in the Object
Inspector. You can drag fields from this tab to the Report Painter
window. If you drag a segment, all the fields in the selected segment
are added to the report.
- View all the
parts of the expression as you build it. With the Expression Builder, drag
and drop the field in the expression and select the logical relation
and comparison type from drop-down lists.
-
Handling
of images. Report Painter:
- Supports layering
for the display of images with other report components.
- Tiles a background
image instead of enlarging the image to fit the background.
-
General
functionality. Report Painter:
- Allows you
to save a report from the Save button on the General toolbar. The
Save button saves all the components in the procedure, not just
the report component.
- Allows a developer
to assign a variable as the display format. This feature enables
a user to select the report output format.
-
Calculated
trends and predicted values. You can calculate trends in data
and predict values beyond the range of values stored in the data
source with the Forecast feature. The Forecast feature uses averages,
or a linear regression line, to distinguish trends and predict values.
This is useful for predicting values that may occur beyond the current data
set.
-
Apportioned
numeric data in tabular reports. You can group numeric data
into any number of tiles (percentiles, quartiles, deciles, and so
on) in tabular reports. For example, you can group student test
scores into deciles to determine which students are in the top ten percent
of the class.
Grouping is based on the values in the
selected vertical (BY) sort field and is apportioned as equally
as possible into the number of tile groups you specify.
-
Navigation
of sort groups from a table of contents. You can add multiple
BY fields to an HTML Table of Contents (TOC). In the previous release,
you could only sort on the highest level BY field in a single request.
With the implementation of this multi-level feature, the TOC option
is available when you right-click any BY field in your report.
For this feature to be useful, the report must
contain at least one vertical sort (BY) field. If you include more
than one sort field in a report, the hierarchy is determined by the
order in which the fields are specified in the request. The TOC
displays, as hyperlinks, all values of the first (highest level)
vertical sort field, as well as the values of any lower level BY
fields that you designate for inclusion. Unless otherwise specified in
the request, a page begins when the highest level sort field changes.
The
TOC itself is an object that appears as an icon in the upper-left
corner of the report, or as one or more drop-down lists in a heading
or footing.
-
Check button
to run procedures against the default server. The Check button
appears in the following tools: Define, Set, Use, and Allocation
Wizard. When you click the Check button, the current procedure is
run against the default server. A dialog box opens that displays
the component's code, and either an error message or text stating
that no error exists.
For more information about Report Painter,
see the Creating Reports With Report Painter manual.
x
The SQL Report Wizard assists you with SQL passthru, which allows
you to execute SQL code that retrieves data from an RDBMS. You can
use the resulting extract file in Report
Painter. The supported engines
are DB2, DB2 for AS/400, Microsoft SQL Server, Oracle, Sybase, and
Teradata.
The SQL Report Wizard is available throughout all development
areas of Developer Studio: Projects,
Data Servers, and Managed Reporting. When working in Managed
Reporting, the tool enables administrators to use SQL in Standard
Reports available in the Domain or use procedures that reside on
the Reporting Server.
For more information, see the Creating Reporting Applications With Developer Studio manual.
x
The Graph Tool provides an easy way to transform almost
any type of data into an effective graph that you can customize
to suit your needs. Working through the tabs of the Graph Tool,
you will see the many features available when creating a graph.
From the tabs in the Graph Tool, you can:
-
Select a graph
type. All of the basic graph types are offered (line, bar, pie
or scatter) with many variations on each type.
-
Select X-axis
and Y-axis values. Add fields to your report to designate the
values for the X-axis and Y-axis, and select a detailed or summarized
display of data.
-
Define parameters
for your data. Include record selection criteria that your data
must satisfy before being included in the graph.
-
Apply drill-down
capability and conditional styling. Drill-down to a more detailed
report or a URL. Apply conditional styling to highlight specific
data in a graph.
-
Add headings,
footings, and graphs titles. Add and position headings, footings,
and graph titles.
-
Create multiple
graphs. Select a second horizontal (X-axis) category to generate
multiple graphs. Multiple graphs can be displayed in an HTML table
or merged into a single graph.
-
Define graph properties. Define
properties for the graph, legend properties, axis labels, graph
colors, grid lines and other display elements.
-
Display missing
data values in a graph. Previously missing data was displayed
as zero. You can display missing data as zero, a gap, dotted line
to zero, or an interpolated dotted line.
-
Customize the
fonts in your graph. You can select the size, style, color,
justification, and rotation for data and label text on the X- and
Y-axis, legend text, and heading text.
-
Temporarily hide
the display of a Y-axis field. This is useful when you want
to temporarily take out one field in the graph, while retaining
all the properties of the current graph.
-
Save graph output
to multiple format. You can save graph output to PNG, SVG, GIF,
and JPEG formats.
The Graph Tool is available for local and server-based development.
x
The Define tool enables you to create a virtual field
as a component in a reporting procedure. A virtual field is evaluated
on each retrieved record that passes any selection criteria on the
real fields. Define the virtual field by assigning a format and
typing an expression or composing it using the calculator and the
fields and functions listed in the tabbed panes in the Define tool
window. The result of the expression is treated as though it were
a real field stored in the data source.
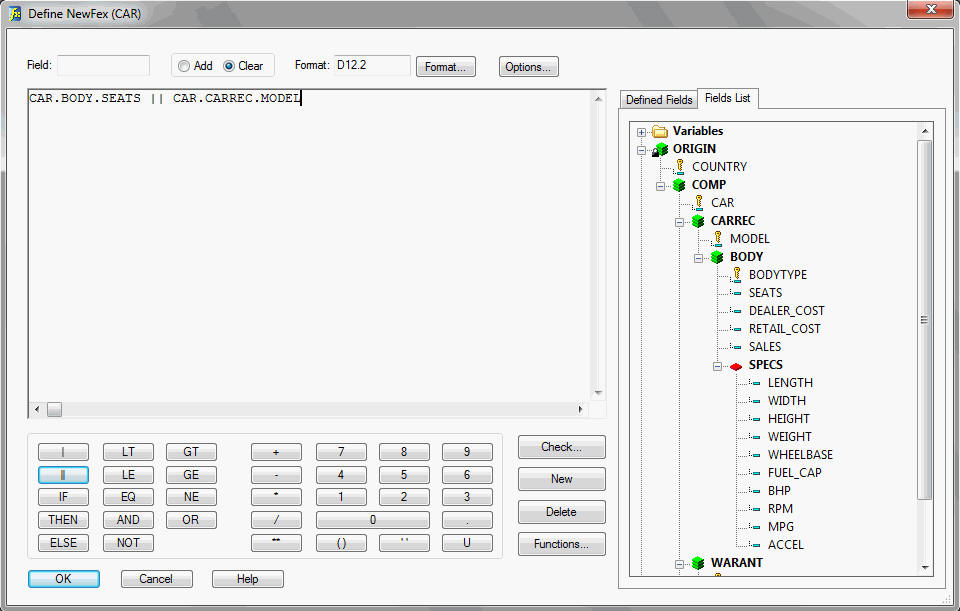
When you click the Check button, the generated code is validated.
A dialog box opens, displaying the component code and either an
error message or text stating that no error exists.
For details about this tool, see Creating
Temporary Fields in the Creating Reporting
Applications With Developer Studio manual.
x
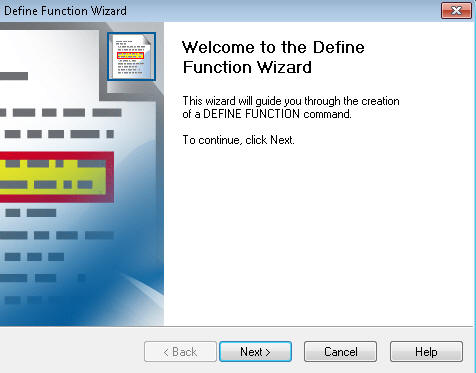
The Define Function wizard guides you through the process
of creating a user function. The first screen of the wizard is shown
in the following image.
You can view the progression of the wizard through the images
that are shown on the following pages.
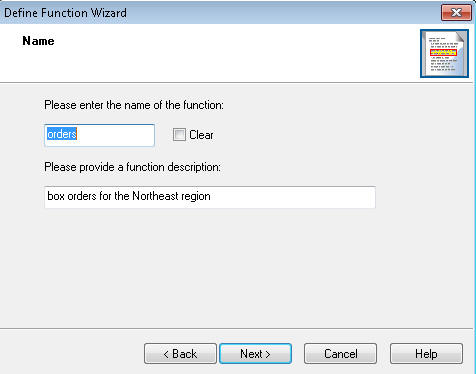
The Name section of the Define Function Wizard is shown in the
following image. In this window, you supply a name for the Define
function, as well as a description.
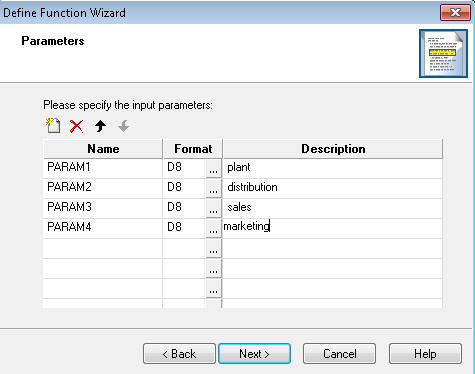
The Parameters section of the Define Function Wizard is shown
in the following image. In this window, you specify the input parameters
of the Define Function. You can rename the parameters, select a
format type, and provide a description.
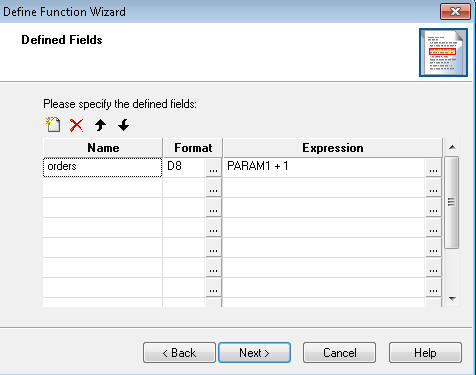
The Defined Fields section of the Define Function Wizard is shown
in the following image. A defined field, with the same name as your
function, appears. You can add multiple expressions to the Define
Function.
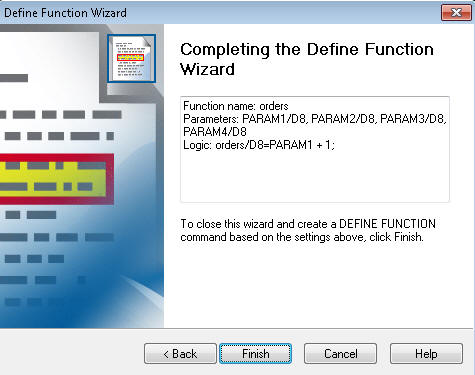
The Complete the Define Function Wizard window is shown in the
following image. The function, as well as its parameters and logic,
are shown in this window before completion of the Define Function.
x
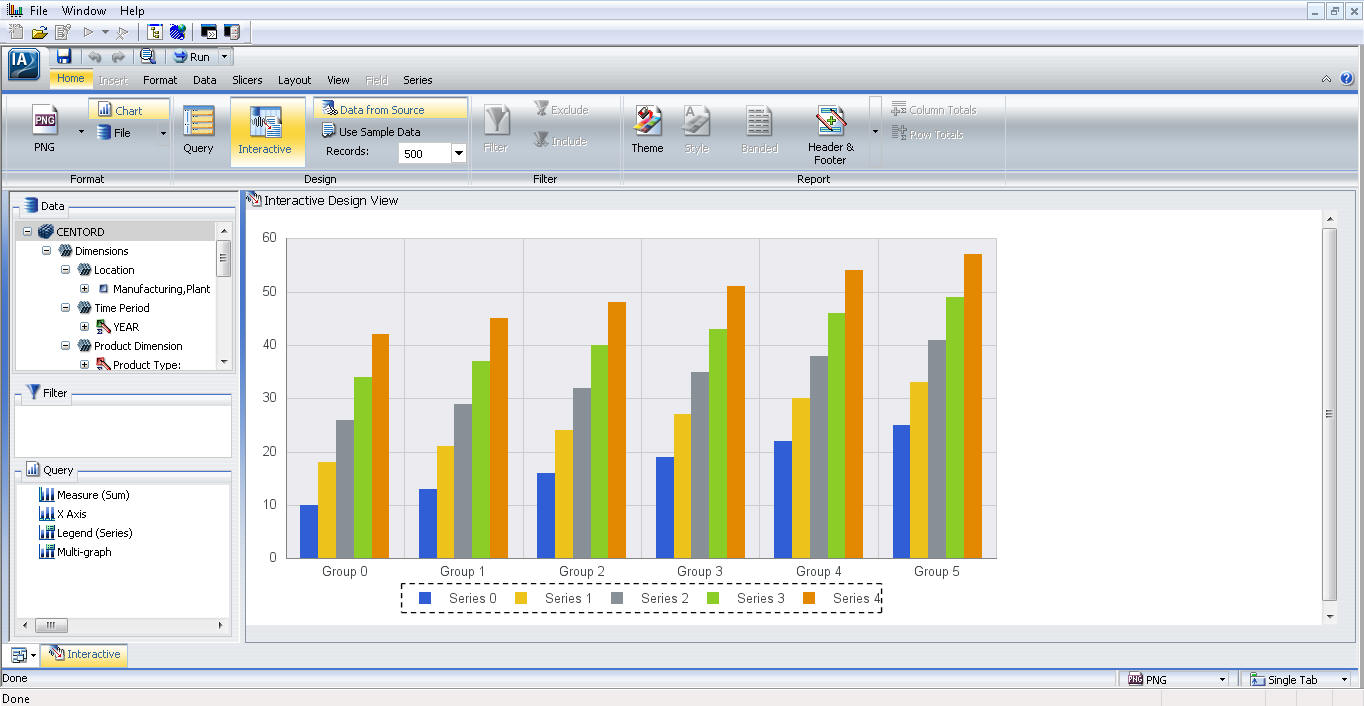
If you would like to create a graph, InfoAssist guides
you through the best way to add a customizable graph to your report.
For more information, see the WebFOCUS InfoAssist manual.
x
The Set tool enables you to customize procedure development.
It controls the way that reports and graphs appear on the screen
or printer, the content of reports and graphs, data retrieval characteristics
that affect performance, and system responses to user requests.
It also helps you set up your metadata and manipulate information,
such as dates.
You can select parameters from a list in the Set tool, and apply
an appropriate value. The tool provides the acceptable values for
most of the parameters.
The Check button replaces the Run button. When you click the
Check button, the generated code is validated. A dialog box opens
that displays a code for the component, and either an error message
or text stating that no error exists.
For details about this tool, see Customizing Your Environment in the Developing
Reporting Applications manual.
x
If a report requires data from
two or more related data sources, you can temporarily join the files
and report from them as if they were one. Joined files remain physically
separate, but are treated as one data source structure.
The Join tool provides a graphical method
for creating and manipulating all types of Joins. You must specify
a host file, then a cross-referenced file to create a join. The
Join tool displays both files and ordinarily, a default Join.
Using the Join tool, you can create:
-
Dynamic
joins. These joins connect two or more data sources that have
two fields, one in each data source, with formats (character, numeric,
or date) and values in common. The common formats ensure the proper
interpretation of the values. This is sometimes called an equijoin,
or inner join, since it is based on equality between fields. Joining
a product code field in a sales data source (the host file) to the
product code field in a product data source (the cross-referenced
file) is an example of this type of join.
-
Joins based
on virtual fields. These joins connect a virtual field in the
host file to a real field in the cross-referenced file. The fields
being joined must have formats and values in common. This is another
type of equijoin.
-
Conditional
joins. These joins connect two or more data sources based on
conditions other than equality between fields. You can define Where
criteria in an expression that determines how to relate records
in the host files to records in the cross-referenced files. For
example, suppose you have a data source that lists employees by
their ID number (the host file) and another data source that lists
training courses and the employees who attended those courses (the
cross-referenced file). Using a conditional join, you could join
employee ID in the host file to employee ID in the cross-referenced file
to determine which employees took training courses in a given date
range (the Where condition).
-
Left Outer
joins. Some rows in a host table may lack corresponding rows
in a cross-referenced table. When a report displays all matching
rows, plus all rows from the host file that lack corresponding cross-referenced
rows, the join is called a left outer join.
For details about this tool, see Joining and Merging Data Sources in the Creating
Reporting Applications With Developer Studio manual.
x
For a file managed by the operating system, such as
an ISAM or comma-delimited data file, the physical file name is
the actual name of a file as it appears to the operating system.
A logical name (or ddname) is a shorthand name that points to the physical
file name. Logical names simplify code by allowing short names to
be used in place of the longer physical file name.
The Allocation Wizard enables you to create a FILEDEF command
and generates platform independent file paths for all portable platforms
by creating FILEDEF syntax with application names.
Tip: Instead of including an allocation component in individual
procedures, you can include all FILEDEF commands in a single file
that you call with the Include tool at the beginning of each procedure.
This enables you to make changes to your allocation assignments
globally instead of changing the information in each procedure.
For more information, see Execute Wizard and Include Tool.
For details about the Allocation Wizard,
see Assigning a Logical Name With the Allocation Wizard in
the Creating Reporting Applications With Developer Studio manual.
x
When you access a FOCUS data source, WebFOCUS searches
for a Master File with the specified file name and then searches
for a data source with the same name. The USE tool enables you to
specify the name and location of a FOCUS data source. This is helpful
under the following conditions:
- The default
naming convention is not used.
- The data source
cannot be found on the standard search path.
- An explicit
extra option is desired.
Tip: Instead of including a USE component in every procedure,
you can create a USE directory by including all USE specifications
in a single file, which you call with the Include tool at the beginning
of each procedure that needs to access the USE directory. For more
information, see Execute Wizard and Include Tool.
The Check button replaces the Run button. When you click the
Check button, the generated code is validated. A dialog box opens,
displaying the code of the component and either an error message
or text stating that no error exists.
For details about this tool, see Accessing a FOCUS Data Source in the Developing
Reporting Applications manual.
x
You can use the Impact Analysis tool to analyze Master
Files and fields and determine if they are used in WebFOCUS procedures. This tool helps developers determine how
frequently a Master File or field is used and the impact that would
result if you change the Master File.
The Impact Analysis tool provides developers with a listing of
all the procedures that are impacted. It can also interactively
open procedures based on the results and make necessary changes.
You can access this tool in the Explorer window of Developer Studio.
xExecute Wizard and Include Tool
The Execute Wizard and the Include tool enable you to
call other procedures from the current procedure.
The Execute Wizard allows one procedure to execute or call another
procedure. The called procedure behaves as a completely separate
procedure, with its own context.
With the Execute Wizard, you can pass parameters directly from
the user interface to the called procedure by automatically checking
the called procedure for available parameters. If parameters are
available, the tool will display the available parameters, allow you
to provide values, and even test the called procedure. The Execute
Wizard is available throughout all development areas of the product:
Projects, Data Servers, and Managed Reporting.
The following screen is the first window of the Execute Wizard.
The Include tool allows one procedure to run another procedure
as if the second one were embedded in the first. In this case, the
procedure being included (called) has full access to variables defined
in the calling procedure. Using this tool, you can create an object that
includes another procedure within a host procedure.
Note: Recursive includes can only be embedded up to four
levels deep.
For details about these tools, see Creating a Reporting Procedure in the Creating
Reporting Applications With Developer Studio manual.
x
The Dimensions Tool allows you to create a temporary OLAP hierarchy
and dimensions. Unlike the Dimension Builder, this tool does not
modify the Master File. Information is stored in the active procedure
instead. You may access the Dimensions Tool by selecting OLAP Dimensions
from the Component Connector toolbox.
To create a hierarchy, drag and drop fields from the left pane
into the Dimensions pane.
x
You can do the following when using the HTML Composer:
- Build an HTML
page. The HTML Composer enables you to add push buttons, hyperlinks,
and other objects that launch other WebFOCUS reports in your application.
- Create an HTML
page for one or more reports that contain parameters.
- Create a complete
report by adding multiple reports and graphs into a single HTML formatted
report.
- Create an advanced
report layout by including images, frames, and other web elements.
You can change the location, size, and properties of all objects
in your layout.
- Directly edit
an HTML page in the HTML Editor or in a third party editor.
- Set background,
font, and other properties in the Style Composer tool.
When you open the HTML Composer, it appears as shown in the following image.
For more information about the HTML Composer,
see the Designing a User Interface for a Web Application With the
HTML Composer manual.
x
Document Composer enables you to design reports, and
to coordinate and distribute layouts made up of multiple reports
and graphs in a single document.
You can position reports and graphs anywhere on a single page
or combine a series of layouts within a single document.
When creating compound reports from Document Composer, PDF, HTML,
active reports, PowerPoint, and Excel are available as output formats.
When you open Document Composer, it appears as shown in the following image.
Note: To include a graph in Document Composer, the graph
must be saved in .SVG format.
For more information about Document Composer,
see the Creating Compound Reports With Document Composer manual.
x
Developer Studio provides a fully integrated
text editor that you can use to create, view, and edit the source
code for procedures, procedure components,
Master and Access files, and other types of files required
by your projects.
The text editor enables you to use familiar Windows editing techniques,
such as cut, copy, paste, undo/redo, and drag-and-drop.
In addition, you can:
- Take advantage
of color-coded syntax designed to make writing, editing, and debugging
procedures easier.
- Bookmark lines
of a file for quick editing and easy reference.
- Find and replace
text.
- Run procedures
or procedure components directly from the Editor.
When you open a Master File, procedure,
or HTML file in the Editor window, syntax elements in the text appear
color-coded for easy viewing and editing. For example, the keywords
in a procedure appear in red. You can change default colors or remove
text coloring to suit your preferences.
For details about this tool, see Editing Application Components as Text in Developer Studio in
the Creating Reporting Applications With Developer Studio manual.
x
The primary location from which you perform OLAP analysis
is the report itself. Any changes you make are instantly applied.
You can sort measure values in ascending or descending order, drill
down on measures and dimensions, change sort fields from vertical
(BY) to horizontal (ACROSS), add a column of data visualization
graphics to track trends, and display a bar graph in a separate
pane above the report.
You can supplement your OLAP analysis with two tools: the Selections
pane and the Control Panel:
- In the Selections
pane, you can change the selection criteria in your report for quick
iterative analysis. A drop-down list is available for each dimension.
You can multi-select values from one or more dimension lists to
refine your report output, display or hide columns, drill down on
and apply data visualization graphics to measures, drag and drop
dimensions to the report frame, and present data in several graph
formats.
- In the OLAP
Control Panel, you can perform many functions that can also be accomplished
from the report or the Selections pane, as well as several unique functions.
You can sort dimensions in ascending or descending order, group
data in tiles (for example, percentiles or quartiles), define selection
criteria based on existing characters, ranges, and dates, stack
measures to limit column widths, and save OLAP reports in PDF and
Excel 2000 formats. In Managed Reporting, users can also save OLAP
output in the My Reports folder.
The following example shows how these controls look when the
selections panel is positioned above the report and adjacent to
the Control Panel.
In the following example, the Control Panel is closed to maximize
the screen space available for your analytic comparisons.
For details about these tools, see Analyzing Data in an OLAP Report in the WebFOCUS
Online Analytical Processing (OLAP) manual.
x
Developer Studio provides an SQL Editor that enables you to code
SQL Passthru and highlights any SQL commands within the code. This
editor also allows you to choose your connection engine and connection
name from drop-down lists on the toolbar. The supported engines
are DB2, DB2 for AS/400, Microsoft SQL Server, Oracle, Sybase, and
Teradata. The SQL Editor provides you with the option to select
another engine.
Note: If you choose the Other option, you must know the
correct syntax to use for the engine name.
The SQL Editor also provides you with the option of preparing
an SQLOUT file, which you can use with Report Painter or Graph Tool.
The SQLOUT file is a temporary file that you can select when you
invoke Report Painter and Graph Tool. It is placed in the Hold Files
area of the Open (Master Files) dialog box.
To access the SQL Editor, open the Procedure Viewer and click
the SQL Editor icon on the Component Connector toolbar. You can
also access the SQL Report icon in the Setup area of the Report
Painter Object Inspector to modify existing procedures.
For more information, see the Creating Reporting Applications With Developer Studio manual.
x
After you create, test, and debug a project in the development environment,
you are ready to make it available as a live application on the
web. This process involves moving certain project files to selected
target servers in a WebFOCUS environment. Developer Studio automates
the process for you.
Deploying a project is the process of copying project files to
a web server and a Reporting Server so the application can run on
the web and be accessed by other users. HTML forms are used to launch
the application in the web environment. The Deploy Wizard guides
you through the process of creating a configuration that manages
the deployment of your project files to the web. You can take advantage
of the following features in the Deploy Wizard:
-
Multiple deployment
scenarios. You can define multiple deployment scenarios and
save them for future deployment. A deployment scenario includes
the partitioning of the project files and the selection of servers.
For example, you might have two deployment scenarios for a project:
one that maps the files to a production server, and another that
maps the files to a test server.
-
Consolidated deployment
tool for Developer Studio and Maintain. The Developer Studio
and Maintain environments have a consolidated deployment tool.
-
Deployment to
multiple servers. You can deploy your project files to multiple
WebFOCUS Reporting or Maintain servers. This enhancement enables
you to access data on multiple servers, run your report components
in the most suitable environment, and speed up your application
processing. It also enables greater control of access to your reporting applications.
This feature is relevant if you develop WebFOCUS reporting applications
or WebFOCUS Maintain applications, and are responsible for deploying
your application to end users who access it from a web browser.
You can create more than one deployment scenario for a project,
and you can view and modify the properties of an existing scenario.
Developer Studio supplies a deployment scenario named Local Deploy,
which it uses to prepare files to run on a local server. Do not
modify or remove Local Deploy.
You must enter and select appropriate information in the New
Deployment Scenario dialog box to create a new deployment scenario.
For details about this tool, see Partitioning and Deploying Project Files in
the Creating Reporting Applications With Developer Studio manual.
x
The Command Console enables
you to send commands directly to a server from Developer Studio.
This benefits users who have worked with Information Builders
products and are already familiar with the command syntax.
The Command Console sends output to your
web browser. Output can include error messages, responses to query
commands, and report output. If you open the Command Console before
you run a procedure, it will also serve as a troubleshooting and
debugging tool.
For details about this tool, see Using the Command Console in the Developing
Reporting Applications manual.
x
The Reporting Server has the capabilities of a regular
Reporting Server, and its configuration procedures are identical.
Reporting Servers can be configured and managed through Server Consoles
that use WebFOCUS technology.
For a full understanding of configuration
options and server capabilities see the Server Administration
for UNIX, Windows, OpenVMS, OS/400 and z/OS manual.
The Reporting Server Console, sometimes referred to as the Web
Console, enables a developer to independently manage the Reporting
Server environment from the desktop product. Using this utility,
you can:
- View server and agent
status.
- View server and agent
statistics.
- Manage agent connections.
If your Reporting Server is secure, WebFOCUS prompts you for
your user name and password.
For details about this tool, see Partitioning and Deploying Project Files in
the Creating Reporting Applications With Developer Studio manual.
Note: When launching this tool from the main toolbar,
or selecting Reporting Server Console from
the Command menu, the console for the project development server
will open. Depending on the type of project development you are
performing (local or remote), the corresponding local or remote
Reporting Server Console will open. Also, when working in the WebFOCUS
Environment area of the Object Explorer, and the Data Servers area
is opened, an icon is enabled in the Object Explorer Toolbar. When
a data server is accessed, this option is enabled to allow users
to open the Reporting Server Console for the selected server. This
is supported on Windows, UNIX, and USS platforms.
x
The Engine tool in Developer Studio exposes the FOCUS ENGINE
SET commands and enables you to enter ENGINE commands or connection
attributes, and override parameters.
Note: The Engine tool is only used to create ENGINE statements.
You are responsible for having the knowledge of the ENGINE SET command
or the Connection Attribute needed.
For more information about this tool, see
the Creating Reporting Applications With Developer Studio manual.
x
You can merge two or more data sources, and specify which records
to merge and which to sort out, using the Match Wizard. The wizard
creates a new data source (a HOLD file) into which it merges fields
from the selected records. You can report from the new data source
and use it as you would any other HOLD file. The merge process does
not change the original data sources.
You select the records to be merged into the new data source
by specifying sort fields in the Match Wizard. You specify one set
of sort fields (using the BY phrase) for the first data source,
and a second set of sort fields for the second data source. The
Match Wizard compares all sort fields that have been specified in
common for both data sources, and then merges all records from the
first data source whose sort values match those in the second data
source into the new HOLD file. You can specify up to 32 sort sets
which includes the number of common sort fields.
In addition to merging data source records that share values,
you can merge records based on other relationships. For example,
you can merge all records in each data source whose sort values
are not matched in the other data source. Yet another type of merge combines
all records from the first data source with any matching records
from the second data source.
You can merge up to 16 sets of data in one Match request. For
example, you can merge different data sources, or data from the
same data source.
Note: The limit of 16 applies to the most complex request.
Simpler requests may be able to merge more data sources.
Access the Match Wizard from the Procedure Viewer in Developer
Studio. It uses typical wizard behavior so you can easily navigate
from one step in the process to the next.
For more information, see the Creating Reporting Applications With Developer Studio manual.