Developing Your Report Request
The only requirement for reporting is identifying a
data source. Beyond that, the structure of a report request is very
flexible and you only need to include the report elements you want. For
example, you only need to include sorting instructions if you want
your report to be sorted, or selection criteria if you want to report
on a subset of your data.
The following are the most frequently used options for structuring
a report request.
(Except where otherwise noted,
see Report Painter Basics in the Creating
Reports With Report Painter manual for details about these
and many other reporting features.)
-
Specifying fields and columns. Each
column in your report represents a field. You can specify which
fields you want to display, which fields you want to use to sort
the report, which fields you want to use to select records, and
which data source fields you want to use in creating temporary fields.
Therefore, specifying the fields you want in a report is fundamentally
tied to how you want to use those fields in your report.
-
Displaying data. You
can display data in your report by listing all the records for a
field (detailed presentation), or by totaling the records for a
field (summary presentation). You can also perform calculations
and other operations on fields, such as finding the highest value
of a field or calculating the average sum of squares of all the
values of a field, and present the results of the operation in your
report.
-
Sorting a report column. Sorting
a report enables you to organize column information. Developer
Studio displays the sort field,
which is the field that controls the sorting order, at the left
of the report if you are sorting vertically, or at the top, if you
are sorting horizontally. Sort fields appear when their values change.
You can also choose not to display sort fields.
You can sort information
vertically, down a column, or horizontally, across a row. You can
also combine vertical sorting and horizontal sorting to create a
simple matrix.
-
Selecting records. When
you generate a report, you may not want to include every record.
Selecting records enables you to define a subset of the data source
based on your criteria and then report on that subset. Your selection
criteria can be as simple or complex as you wish.
-
Showing subtotals and totals. You
can display column and row totals, grand totals, and section subtotals
in your report.
-
Customizing the presentation. A
successful report depends upon the information presented and how
it is presented. A report that identifies related groups of information and
draws attention to important facts will be more effective than one
that simply shows columns of data. For example, you can:
- Give column
titles more meaningful names.
- Control the
display of columns in your report.
- Create headings
and footings for different levels of the report (including each
sort group, each page, and the entire report), and dynamically control
the display of headings and footings based on conditions you set.
- Add fonts,
colors, grids, and images.
- Highlight a
group of related information and separate it from other groups by inserting
blank lines, underlines, and page breaks.
-
Creating temporary fields. When
you create a report, you are not limited to the fields that already
exist in the data source. You can create temporary fields, deriving
their values from real data source fields, and include them in your
report.
For details
see, Creating Temporary Fields.
-
Joining data sources. You
can join two or more data sources to create a larger integrated
data structure from which you can report in a single request.
For details, see Joining Data Sources in the Creating
Reports With WebFOCUS Language manual.
-
Storing and reusing the results. You
can store your report data as a data source against which you can
make additional queries. This is especially helpful for creating
a subset of your data source and for generating two-step reports.
You can also format the new data source for use by other data processing
tools, such as spreadsheets and word processors.
For
details, see Saving and Reusing Report Output in the Creating
Reports With WebFOCUS Language manual.
You can run the request as an ad hoc query or save it as a procedure.
Saving a report request as a procedure enables you to run or edit
it at any time.
xLowercase Directory Names and File Names in WebFOCUS From UNIX
When working with WebFOCUS GUI tools that access directories
and files from a UNIX system, the WebFOCUS Reporting Server returns
lowercase directory names and files, by default. The WebFOCUS GUI
tools also create directories and files in lowercase, regardless of
the text case specified (for example, lowercase, uppercase, or mixed-case).
If the user creates directories or files at the UNIX command level,
they must create them in lowercase.
xStarting a Report Request
A report request begins with the designation of a data source.
You can then specify the details of your report request.
A report request can use a Master File
that is stored in the application directory or in the WebFOCUS Reporting
Server APP PATH or baseapp directory.
x
Procedure: How to Start a Report Request
-
To create
a new procedure:
- With the Procedures
folder highlighted, select New from the File
menu.
or
- Right-click
the Procedures folder and select New from
the pop-up menu, then select Procedure.
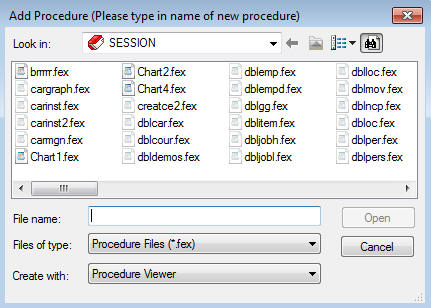
The
following image shows the Add Procedure dialog box that opens.
-
Enter
a name for the new procedure in the File name field.
-
Select the tool you want to use from
the Create with drop-down list. The options are:
Procedure Viewer opens the Component
Connector toolbox.
Report Painter enables
you to create complex styled reports.
Composer enables
you to design reports, and to coordinate and distribute layouts
made up of multiple reports and graphs in a single output file.
SQL
Report Wizard assists you with SQL passthru which allows
you to execute SQL code that retrieves data from an RDBMS. You can
use the resulting extract file in Report Painter or InfoAssist.
InfoAssist enables
you to create a chart using an easy to use graphical tool.
Text
Editor enables you to create a procedure with code.
Define
Function enables you to create virtual fields.
-
Click Open.
If you select Report Painter, Composer,
or Text Editor, the selected tool opens.
If
you select Procedure Viewer, the Component Connector toolbox opens.
Do the following:
-
Click a component connector (yellow diamond) at the point where
you want to include the report in the procedure, then click the Report button
on the component connector toolbar.
The Open dialog box opens.
-
Select the Master File you want to report against.
-
Click Open.
The tool you selected opens.
xCreating a Report Example
The example in this topic is a simple report request
that illustrates some of the basic functions of Developer Studio. However,
there are many more functions not shown here that you can find information
on throughout this documentation.
Example: Creating a Simple Report
The
following annotated example illustrates some of the basic functions
of Developer
Studio. The numbered explanation in this example corresponds
with the code in this request. This request can be generated using
Developer Studio graphical tools, or by typing the commands into
a text editor.
1.  JOIN PIN IN EMPDATA TO ALL PIN IN TRAINING AS J1
2.  DEFINE FILE EMPDATA
    YEAR/YY=COURSESTART;
3.  END

4.  TABLE FILE EMPDATA
5.  HEADING CENTER
    "Education Cost vs. Salary"
6.  SUM EXPENSES AS 'Education,Cost' SALARY AS 'Current,Salary'
7.  AND COMPUTE PERCENT/D8.2=EXPENSES/SALARY * 100; AS 'Percent'
8.  BY DIV
    BY DEPT
9.  WHERE YEAR EQ 1991
10. ON TABLE SUMMARIZE
11. ON TABLE SET STYLE *
    TYPE=HEADING, STYLE=BOLD, COLOR=BLUE,$
    TYPE=REPORT, FONT=TIMES, SIZE=8,$
    TYPE=REPORT, GRID=OFF,$
    ENDSTYLE
12. END
The output is:
The
request processes in the following way:
- The JOIN command
joins the EMPDATA and TRAINING data sources, allowing the request
to access information from both data sources as if it were a single
structure.
- The DEFINE
command creates a virtual field which extracts the year from the COURSESTART
field in the TRAINING data source.
- The END command
ends the DEFINE command.
- The TABLE command
begins the report request.
- The HEADING
command adds the heading, Education Cost vs. Salary to the report output.
- The SUM command
adds the values within both the EXPENSES field and the SALARY field.
The AS phrase changes the name of the column headings.
- The COMPUTE
command creates a calculated value using the values that have been aggregated
in the SUM command and sorted with the BY command.
- The BY phrase
sorts the data in the report by the DIV field, and then by the DEPT
field.
- The WHERE command
includes only the data that falls in the year 1991.
- The ON TABLE
SUMMARIZE command adds all values in both the EXPENSES and SALARY
columns, and recalculates the Percent column.
- The StyleSheet
information formats the report heading and content.
- The END command
ends the report request.
x
When you exit a reporting tool, you are prompted to
save the report you have created. For details, see Report Painter Basics in the Creating
Reports With Report Painter manual for additional save options
available in that tool.
When you save a procedure created in Report Painter or the Component
Connector toolbox, the entire procedure is saved, not only the report
component.
x
Procedure: How to Save a Report
Close the reporting tool and choose Yes to
save the changes.
or
Select Save from
the File menu. Your report is saved as a component in the procedure
in which it was created.
If you add other components to a
procedure or edit the report component, you will be prompted to
update the procedure (FOCEXEC). Click Yes to
save your changes.