In this section: |
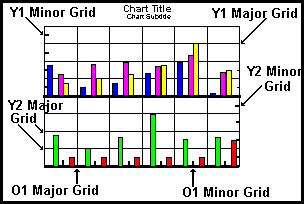
Each axis in a graph can include or exclude major and minor grid lines. Properties and methods also allow you to specify the number and style of grid lines displayed on each axis. The following illustration shows a bi-polar graph where major and minor grid lines have been enabled on the ordinal (O1) axis and both numeric (Y1 and Y2) axes.

Use these properties to control the grid lines on the ordinal axis:
These properties control the number, display, and style of ordinal axis major and minor grid lines. Major and minor grid lines can appear in one of the following styles:
|
0= |
No grid lines. |
|
1= |
Normal grid lines, height of frame. |
|
2= |
Normal grid lines extended beyond the height of frame. |
|
3= |
Small tick marks from frame edge inward. |
|
4= |
Small tick marks from frame edge outward. |
|
5= |
Ticks span across the frame edge. |
All graphs can include major and minor grid lines. In the default configuration, major grid lines are drawn and minor grid lines are not drawn. Different styles can be assigned to major and minor grid lines so that they are easily distinguished in the graph. Use of the WebFOCUS grid setting (SET GRID = ON) displays major grids for both X- and Y- axes.
Use these methods to control the appearance of grid lines on the numeric axes in a graph.
The GridDisplay properties control the display of major and minor grid lines on the numeric axes. True is the default value for major grid lines and false is the default value for minor grid lines. The GridStyle properties select the style of numeric axis grid lines:
|
0= |
No grid lines. |
|
1= |
Normal grid lines, height of frame. |
|
2= |
Normal grid lines extended beyond the height of frame. |
|
3= |
Small tick marks from frame edge inward. |
|
4= |
Small tick marks from frame edge outward. |
|
5= |
Ticks span across the frame edge. |
Typically different styles are used for major and minor grid lines so that they are easily distinguished in the graph.
The GridStep and GridStepAuto properties control the number of numeric axis grid lines according to the number of values displayed on an axis. If the GridStepAuto property is enabled, the number of grid steps is automatically calculated and the value assigned to the associated GridStep property will be ignored. If the GridStepAuto property is disabled, the GridStep property controls the number of major or minor grid lines that will be imaged. For example, grid steps 1, 6, 11, 16...51 will be imaged if the range of values in the graph is 1...51 and this property is set to 5. If this property is set to 10, grid steps 1, 11, 21, 31...51 would appear.
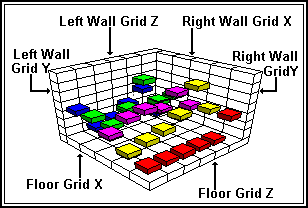
Grid lines can appear on the floor and walls of the cube in a 3D graph.

The following properties enable and disable these grid lines:
Grids can also appear on risers in 3D graphs using these properties:
In addition to the axis-specific grid properties, you can use these methods to get/set grid attributes:
When you use these methods, you may supply the object ID of a grid as an input parameter to identify the grid to which the attribute is applied. If a grid is not specified, the attribute is retrieved from or assigned to the first item in the selection list. If the object ID does not identify a grid object or the first item in the selection list is not a grid object, a set operation will apply the attribute to the object but it will not have any effect on the appearance of the graph.
| WebFOCUS |