riserBevel: 'string'where:
- 'string'
Is a string that defines the bevel type. The default value is undefined.
- For bar charts, the values can be:
- bevel
Applies a slight angle at the edges of the risers, giving them a beveled appearance.
- cylinder
Draws the risers as cylinders with gradient color.
- darken
Applies a gradient to the risers that darkens toward the bottom for vertical risers, and darkens toward the left for horizontal risers.
- darkenInverted
Applies a gradient to the risers that darkens toward the top for vertical risers, and darkens toward the right for horizontal risers.
- lighten
Applies a gradient to the risers that lightens toward the bottom for vertical risers, and lightens toward the left for horizontal risers.
- lightenInverted
Applies a gradient to the risers that lightens toward the top for vertical risers, and lightens toward the left for horizontal risers.
- For bubble and scatter charts, the values can be:
- darken
Applies a circular gradient to the markers that transitions from the original marker color to a darker color.
- lighten
Applies a circular gradient to the markers that transitions from the original marker color to a lighter color.
- For pie charts, the values can be:
- bevel
Applies an angle at the outer edge of the pie.
- cylinder
Makes the pie look more cylindrical using a darkening gradient effect.
- donut
Draws the pie with a donut effect if it has a hole.
- For bar charts, the values can be:
Bevel types darken and lighten will also be applied to legend markers (if visible).
The following request against the GGSALES data source generates a bar chart with no bevel effect:
GRAPH FILE GGSALES
SUM DOLLARS BUDDOLLARS UNITS BUDUNITS
BY REGION
ON GRAPH PCHOLD FORMAT JSCHART
ON GRAPH SET LOOKGRAPH VBAR
ON GRAPH SET STYLE *
*GRAPH_JS
series: [
    {series: 0, color: 'lightgreen'},
    {series: 1, color: 'coral'},
    {series: 2, color: 'lightblue'},
    {series: 3, color: 'burlywood'},
]
*END
ENDSTYLE
END
The output is:

The following version of the request, applies the riserBevel: 'bevel' effect:
GRAPH FILE GGSALES
SUM DOLLARS BUDDOLLARS UNITS BUDUNITS
BY REGION
ON GRAPH PCHOLD FORMAT JSCHART
ON GRAPH SET LOOKGRAPH VBAR
ON GRAPH SET STYLE *
*GRAPH_JS
   riserBevel: 'bevel',
series: [
    {series: 0, color: 'lightgreen'},
    {series: 1, color: 'coral'},
    {series: 2, color: 'lightblue'},
    {series: 3, color: 'burlywood'},
]
*END
ENDSTYLE
EN
On the output, the risers are not totally flat. They have a slight angle at their edges:

Changing the property to riserBevel: 'cylinder' generates the following chart, in which the risers are drawn as cylinders with gradient color:
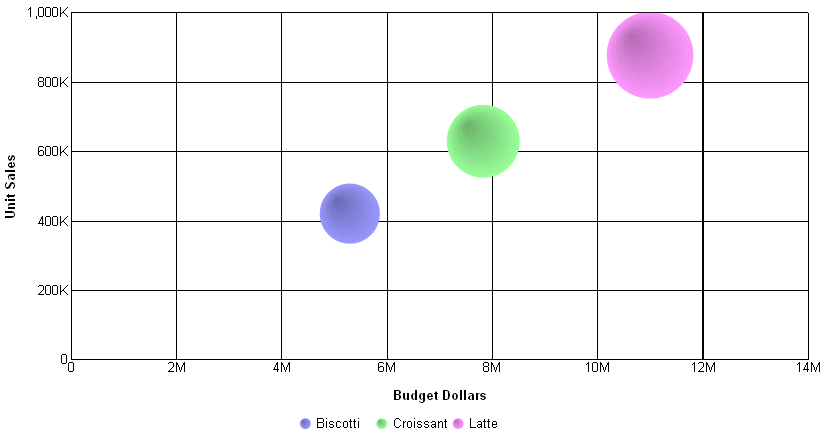
The following request against the GGSALES data source applies the bevel effect 'darken' to the bubble markers and legend markers:
GRAPH FILE GGSALES
SUM  BUDDOLLARS UNITS DOLLARS
BY PRODUCT
WHERE PRODUCT EQ 'Latte' OR 'Croissant' OR 'Biscotti'
ON GRAPH PCHOLD FORMAT JSCHART
ON GRAPH SET LOOKGRAPH BUBBLE
ON GRAPH SET STYLE *
*GRAPH_JS
border: {width:0},
series: [{series:'all', marker:{shape:'circle'}}],
   riserBevel: 'darken'
*END
ENDSTYLE
END
The output is: