Syntax: How to Apply Depth to Charts
depth: numberwhere:
- number
Is a number from 0 to 100 that specifies the amount of depth as a percent of the available space to apply to risers and the chart frame. Use zero or undefined for no 2.5D depth effect. The default value is undefined.
Example: Applying Depth to a Chart
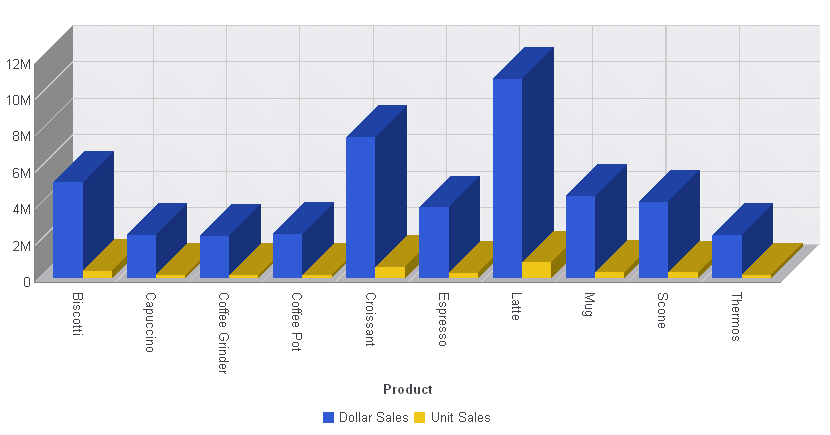
The following request against the GGSALES data source generates a vertical bar chart with a depth property of 25:
GRAPH FILE GGSALES
SUM DOLLARS
UNITS
BY PRODUCT
ON GRAPH PCHOLD FORMAT JSCHART
ON GRAPH SET LOOKGRAPH VBAR
ON GRAPH SET STYLE *
*GRAPH_JS
  depth: 25,
*END
INCLUDE=ENIADefault_combine.sty,$
ENDSTYLE
END
On the output, the chart has been drawn with 2.5D affect:
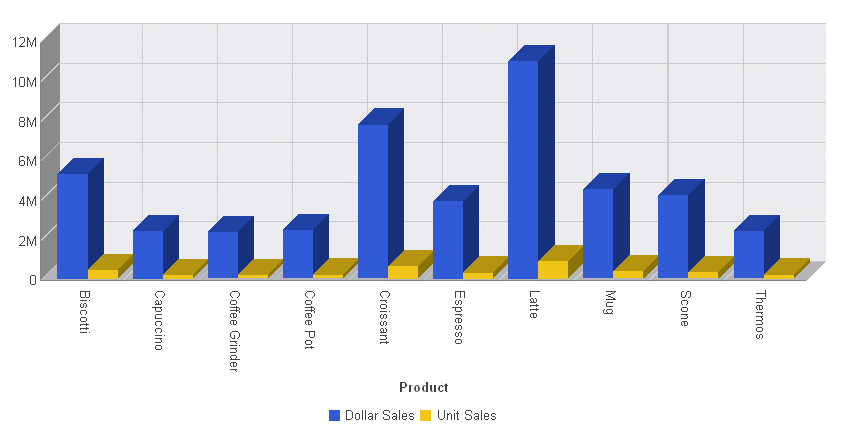
Changing the depth value to 50 draws the chart with a deeper 2.5D affect: