The following shows the structure of a GRAPH FILE request:
GRAPH FILE filename [HEADING ...]
{PRINT|SUM} field ...
{BY|ACROSS} sortfield ...
[{WHERE|IF} expression ...[WHEN condition]] ... [FOOTING ...]
ON GRAPH PCHOLD FORMAT JSCHART
[ON GRAPH SET LOOKGRAPH charttype]
[ON GRAPH SET optional_parameter ...]
ON GRAPH SET STYLE *
[*GRAPH_JS
 JSON methods and properties
*END]
[*GRAPH_SCRIPT
 Legacy Graph API methods and properties
 *END]
[WebFOCUS StyleSheet declarations ]
ENDSTYLE
END
The following table describes each command :
Request Syntax | Description |
|---|---|
GRAPH FILE filename | Required start of charting request. |
[HEADING ...] | Optional title for the chart. By default, the heading is placed on the HTML page above the chart. To embed the heading in the chart, include the ON GRAPH SET EMBEDHEADING ON command in the request. With this setting, the heading replaces the JSON chart title object. If you also include a JSON title object in the request, it will override the WebFOCUS heading. |
{PRINT|SUM} field ... | Required display command. Fields must be numeric. They can be real fields, virtual fields, or calculated values. PRINT displays individual field values, SUM aggregates them within the sort values. |
{BY|ACROSS} sortfield ... | Required sort phrase. |
[{WHERE|IF} expression ...[WHEN condition]] ... | Optional filtering criteria. |
[FOOTING ...] | Optional footing for the chart. By default, the footing is placed below the chart on the HTML page. To embed the footing in the chart, include the ON GRAPH SET EMBEDHEADING command in the request. With this setting, the footing replaces the JSON chart footnote object. If you also include a JSON footnote object in the request, it will override the WebFOCUS footing. |
ON GRAPH PCHOLD FORMAT JSCHART | Required SET command for creating HTML5 output. |
[ON GRAPH SET LOOKGRAPH charttype ON GRAPH SET AUTOFIT ON ON GRAPH SET GRAPHDEFAULT OFF ON GRAPH SET VZERO OFF ON GRAPH SET GRMERGE ADVANCED ON GRAPH SET GRMULTIGRAPH 0 ON GRAPH SET GRLEGEND 0 ON GRAPH SET GRXAXIS 1] | Optional SET commands. For information about the optional SET commands, see WebFOCUS Chart Parameters and the Developing Reporting Applications manual. |
ON GRAPH SET STYLE * | Start of the style section of the request. The style section can include JSON blocks, legacy graph API blocks, and WebFOCUS StyleSheet declarations. They can appear in any order and there can be multiple blocks of each type. Note: JSON properties overwrite any duplicate properties set in legacy graph API blocks or WebFOCUS StyleSheet declarations. Properties set in legacy API calls override any duplicate properties set in WebFOCUS StyleSheet declarations. With conflicting properties of the same type, the last one in the style section of the request takes precedence. |
[*GRAPH_JS
 JSON methods and properties
*END] | Start and end of an optional JSON block of the style section. |
[*GRAPH_SCRIPT
 Legacy graph methods and properties
*END] | Start and end of an optional legacy graph API block of the style section. These blocks are supported for backward compatibility, so that existing requests that contain these API calls can be converted to HTML5 charts without any changes except to include the ON GRAPH PCHOLD FORMAT JSCHART command. |
[WebFOCUS StyleSheet declarations] | Optional WebFOCUS StyleSheet declarations. For information about StyleSheet declarations, see the Creating Reports With WebFOCUS Language manual. |
ENDSTYLE | End of the style section of the request. |
END | Required end of the request. |
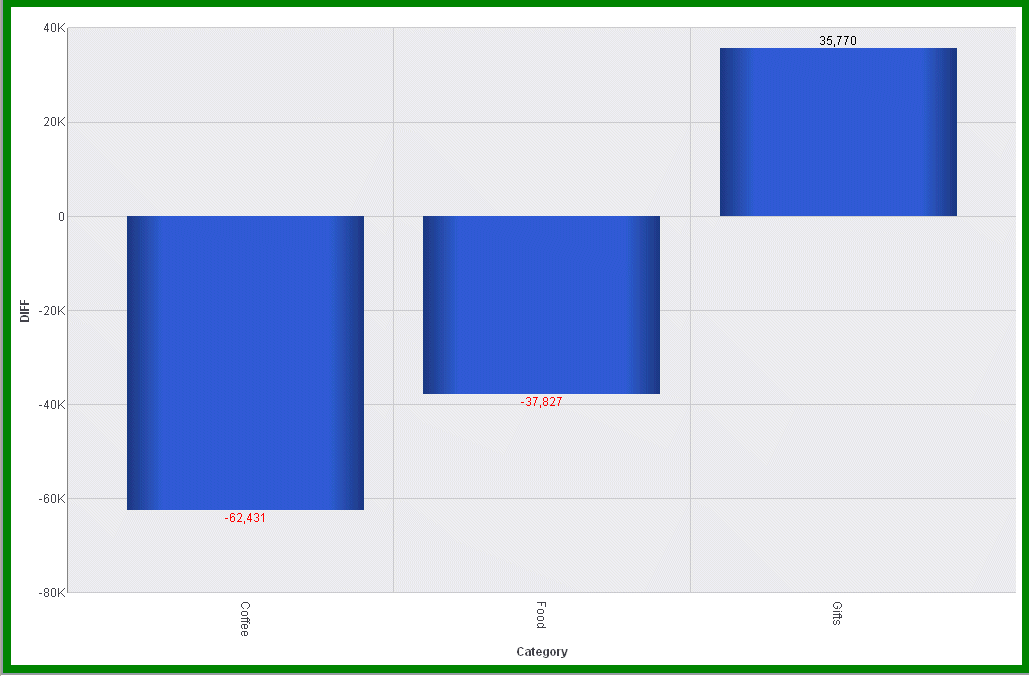
The following request against the GGSALES data source creates a vertical bar chart (ON GRAPH SET LOOKGRAPH VBAR). The y-axis represents the virtual field named DIFF, and the x-axis represents the sort field CATEGORY:
-* Create virtual field
DEFINE FILE GGSALES
DIFF/D12.2= DOLLARS-BUDDOLLARS ;
END
-*Define default values for amper variables referenced in the request
-DEFAULTH &WF_STYLE_UNITS='PIXELS';
-DEFAULTH &WF_STYLE_HEIGHT='405.0';
-DEFAULTH &WF_STYLE_WIDTH='770.0';
-* GRAPH request starts
GRAPH FILE GGSALES
SUM DIFF
BY CATEGORY
-*Required SET parameter for HTML5 output
ON GRAPH PCHOLD FORMAT JSCHART
-*Optional SET parameters
ON GRAPH SET GRAPHDEFAULT OFF
ON GRAPH SET UNITS &WF_STYLE_UNITS
ON GRAPH SET HAXIS &WF_STYLE_WIDTH
ON GRAPH SET VAXIS &WF_STYLE_HEIGHT
ON GRAPH SET LOOKGRAPH VBAR
ON GRAPH SET AUTOFIT ON
-*Style section starts
ON GRAPH SET STYLE *
-*JSON block starts
*GRAPH_JS
mouseOverIndicator: {enabled: true,color: ' '},
introAnimation: {
enabled: true,
duration: 1000
}
*END
-*WebFOCUS StyleSheet declarations start
INCLUDE=ENIADefault_combine.sty,$
TYPE=REPORT, PAGECOLOR = Green,$
-*Legacy graph API block starts
*GRAPH_SCRIPT
setUseNegativeDataTextColor(true);
setDataTextDisplay(true);
*END
ENDSTYLE
END
On the output:
- The JSON block in the style section causes the drawing of the chart to be animated. It also causes a riser to change color and display a tooltip when you mouse over it,
- The WebFOCUS StyleSheet declarations cause the chart styles to be taken from the included StyleSheet file ENIADefault_combine.sty, and cause the color of the page on which the chart is drawn to be green.
- The legacy graph API block causes the data text for negative risers to be displayed in red:
