How to: |
On a map chart, there is a base layer that displays the map tiles.
On top of the base layer, an overlay layer displays the WebFOCUS request output that either colors specified areas on the map or draws bubble markers on top of them.
WebFOCUS supports one base layer and one overlay layer.
WebFOCUS is licensed to access Esri ArcGIS maps, which exist on an Esri server. If you are licensed to use a different map provider, you can access their maps instead.
In addition, free Mapbox© OpenStreet© maps are installed with WebFOCUS. You can use them if you are not able to import the Esri maps into your system.
Since the maps displayed on any map chart are owned by the services that supply them, they require that you include a copyright attribution on your chart, which is one of the properties you must include in the base layer.
The connection between the map locations and the fields in your data source are implemented using a JSON or geoJSON location file. WebFOCUS supplies JSON location files, but you can add additional locations or different types of location files by adjusting the map properties to point to the files you want.
The location files contain lists of major political subdivisions (such as state and city) along with the latitudes and longitudes that define the borders of the primary subdivision (for example, in the USA, state).
The following code shows a snippet of the beginning of the US.JSON location file, which lists US cities and states. The primary layer (map subdivision) is called regions. The position property contains the latitude and longitude of the city:
"map_type":"country",
"country_name":"United States of America",
"iso_a2":"US",
"primary_layer":"regions",
"layers":[{
"type":"cities",
"geocode":["city_name"],
"units":"decimal_degrees",
"geometry_type":"point",
"primary_name_field":"city_name",
"features":[{
"city_name":"New York",
"rank":"0",
"region":"New York",
"position":[-73.98,40.7499],
"size":24.2
}, {
"city_name":"Washington, D.C.",
"rank":"0",
"region":"District of Columbia",
"position":[-77.0094,38.8995],
"size":22
},
{
"city_name":"Los Angeles",
"rank":"0",
"region":"California",
"position":[-118.1799,33.9899],
"size":23.6The following code shows the beginning of the state definitions. Note that the type is regions and the fields include state_name and state_abbr. Each state definition also includes latitudes and longitudes for its borders:
"type":"regions", "geocode":["state_abbr","state_name","state_fips","iso_3166_2"], "units":"decimal_degrees", "geometry_type":"polygon", "primary_name_field":"state_name", "primary_abbr_field":"state_abbr", "primary_id_field":"state_abbr", "features":[{ "state_name":"Hawaii", "state_abbr":"HI", "state_fips":"15", "iso_3166_2":"US-HI", "borders":[[[-155.9633,19.0815],[-155.9432,19.3442], [-156.1192,19.7364],[-155.8843,20.0183],[-155.959,20.2268], [-155.8367,20.3212],[-155.1403,19.9894],[-154.7566,19.5069], [-154.9396,19.3128],[-155.466,19.0953],[-155.649,18.8705]], [[-156.5651,20.7389],[-156.7519,20.9136],[-156.6058,21.0925], [-156.451,20.9687],[-156.2685,21.0037],[-155.9589,20.875], [-155.9267,20.7817],[-156.0299,20.604],[-156.375,20.5289], [-156.4845,20.579],[-156.5334,20.4629],[-156.75,20.4543], [-156.7336,20.5818],[-156.4957,20.6915]],[[-158.3176,21.5391], [-158.3242,21.6156],[-157.9417,21.7545],[-157.6505,21.485], [-157.6009,21.2829],[-157.8102,21.1992],[-158.1347,21.2423]], [[-159.7936,21.9397],[-159.8481,22.076],[-159.6129,22.2722], [-159.3896,22.2875],[-159.25,22.1757],[-159.2843,21.9406], [-159.4328,21.8207]],[[-157.015,21.2611],[-156.722,21.226], [-156.6527,21.125],[-156.8779,20.9933],[-157.3637,21.0923], [-157.2812,21.2725]],[[-175.9394,27.6882],[-176.0396,27.7582], [-175.921,27.8214],[-175.9814,27.9132],[-175.7043,27.9827], [-175.7341,27.7388]],[[-157,20.6968],[-157.1112,20.9312], [-156.8684,20.9643],[-156.75,20.8076],[-156.875,20.6909]], [[-160.2589,21.7428],[-160.2799,21.9206],[-160.0634,22.0726], [-160.031,21.8693]],[[-166.1722,23.587],[-166.3844,23.8319], [-166.307,23.9248],[-166.1823,23.9023],[-166.1067,23.7425]], [[-178.3014,28.3283],[-178.4404,28.4051],[-178.375,28.51], [-178.2384,28.4561]],[[-174.0064,25.9902],[-174.0547,26.1077], [-173.9579,26.1356],[-173.9033,26.06]],[[-171.7374,25.7065], [-171.8096,25.7813],[-171.75,25.8379],[-171.6679,25.7812]], [[-161.9318,23.0053],[-161.9825,23.0912],[-161.8875,23.1103]], [[-164.723,23.5217],[-164.7611,23.5934],[-164.6826,23.6228], [-164.6453,23.5515]],[[-160.5707,21.6066],[-160.5918,21.6858], [-160.5087,21.7032],[-160.4849,21.6324]],[[-168.0235,24.9544], [-168,25.0522],[-167.9442,24.9898]]] },
In order to connect the map data with the data in your data source, you must identify the type of subdivision you are using and the field in the location file that has the same data as the sort field in your WebFOCUS request. For example, if your data source has state names, you must identify regions as the type of subdivision to use and state_name as the field name to use from the location file.
mapProperties:{
baselayers: [{
title: 'layer_title',
layerInfo: {
maxZoom: max,
minZoom: min,
attribution: function(){ return "&|copy; <a target='_blank' href='http://www.InformationBuilders.com'>Information Builders</a> | " +
"Map Tiles: &|copy; Esri";}
},
url: function(){ return 'http://services.arcgisonline.com/ArcGIS/rest/services/World_Street_Map/MapServer/tile/{z}/{y}/{x}';}
}]
}where:
- layer_title
Is a title for the layer. This title appears when you click the layer control displayed at the top right of the map.
- max
Is the value -1 (fully automatic) or a number between 1 and 19 that defines the maximum zoom level allowed.
- min
Is the value -1 (fully automatic) or a number between 1 and 19 that defines the minimum zoom level allowed.
- z
Is the initial zoom level, specified in the initPos:level property,
- y
Is the latitude for the center of the initial view, specified in the initPos:center property,
- x
Is the longitude of the initial view, specified in the initPos:center property,
Note:
- You can disable the zoom (+/-) control, but not remove it altogether, by making minZoom=maxZoom.
- The attribution property defines the copyright statement that appears on the bottom right of the map. The attribution included in the previous code displays the copyrights for the map providers included with WebFOCUS. If you use maps from a different provider, edit the attribution to contain the copyright information for your provider.
- The url property in the previous code points to one type of map (World_Street_Map) provided by Esri. If you use maps from a different provider, edit this property to point to your map tile server.
The following are different types of maps provided by Esri and the url references needed to access them:
http://services.arcgisonline.com/ArcGIS/rest/services/World_Street_Map/MapServer/tile/{z}/{y}/{x};
http://services.arcgisonline.com/ArcGIS/rest/services/World_Topo_Map/MapServer/tile/{z}/{y}/{x};
http://services.arcgisonline.com/ArcGIS/rest/services/World_Imagery/MapServer/tile/{z}/{y}/{x};
http://services.arcgisonline.com/ArcGIS/rest/services/World_Terrain_Base/MapServer/tile/{z}/{y}/{x};
http://services.arcgisonline.com/ArcGIS/rest/services/Canvas/World_Light_Gray_Base/MapServer/tile/{z}/{y}/{x};
http://services.arcgisonline.com/ArcGIS/rest/services/NatGeo_World_Map/MapServer/tile/{z}/{y}/{x};
http://services.arcgisonline.com/ArcGIS/rest/services/Ocean_Basemap/MapServer/tile/{z}/{y}/{x};The following code shows the attribution and url properties for using the OpenStreetMap maps installed with WebFOCUS:
attribution: function(){ return '&|copy; <a href="http://www.ibi.com">IBI</a> | ' +
'Map data &|copy; <a href="http://www.openstreetmap.org/copyright">OpenStreetMap</a> contributors, Open Database Licence';}
},
url: function(){ return tdgchart.getScriptPath().replace(/\/tdg\/.*/,'') + '/maptiles/osm/{z}/{x}/{y}.png'}The following code shows the attribution and url for another type of OpenStreet map provided by mapbox, installed with WebFOCUS:
attribution: "Map data &|copy; <a href='http://www.openstreetmap.org/copyright'>OpenStreetMap</a> contributors, Open Database Licence | Map Tiles by <a href='http://mapbox.com'>Mapbox</a>",
url: 'http://{s}.tiles.mapbox.com/v3/bclc-apec.map-rslgvy56/{z}/{x}/{y}.png',
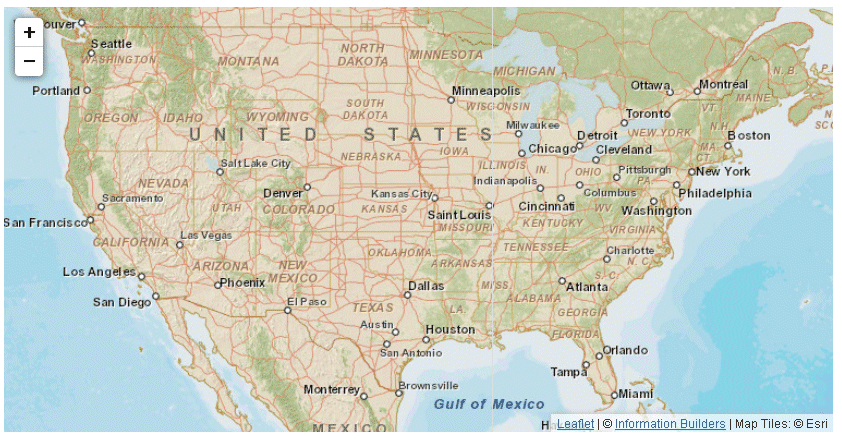
The following sample sets and initial position and zoom level and generates the map base layer:
GRAPH FILE STATEPOP
SUM POPULATION
BY STATE
ON GRAPH PCHOLD FORMAT JSCHART
ON GRAPH SET LOOKGRAPH CHOROPLETH
ON GRAPH SET STYLE *
*GRAPH_JS
mapProperties: {
engine: 'leaflet',
leaflet: {
initPos: {
center: [37.8, -96],
level: 4
},
baselayers: [{
title: "ArcGIS_World_Street_Map",
layerInfo: {
maxZoom: 17,
minZoom: 0,
attribution: function(){ return "&|copy; <a target='_blank' href='http://www.InformationBuilders.com'>Information Builders</a> | " +
"Map Tiles: &|copy; Esri";}
},
url: function(){ return 'http://services.arcgisonline.com/ArcGIS/rest/services/World_Street_Map/MapServer/tile/{z}/{y}/{x}';}
}]
}
},
*END
ENDSTYLE
ENDOn the resulting map, the request output is not represented, as that would go on the overlay layer:
mapProperties:{
overlayLayers: [{
title: 'layer_title',
dataLookup: 'properties.field',
layerInfo: {
maxZoom: max,
minZoom: min,
type: 'subdivision'
},
type: 'filetype',
url: function(){ return tdgchart.getScriptPath() + 'map/location.json'}
}]
}where:
- layer_title
Is a title for the layer. This title appears when you click the layer control displayed at the top right of the map.
- max
Is the value -1 (fully automatic) or a number between 1 and 19 that defines the maximum zoom level allowed.
- min
Is the value -1 (fully automatic) or a number between 1 and 19 that defines the minimum zoom level allowed.
- field
Is the name of the field in the location file that contains the same data as the sort value in your request.
- 'subdivision'
Is the type of geographical subdivision as listed in the location file.
- 'filetype'
Defines the type of location file being used. Valid values are:
- 'tdg', which supports both the JSON files distributed with WebFOCUS and geoJSON location files.
- 'geojson', which supports only geoJSON location files.
- location
Is the name of the location file, for example, US.JSON. If you are using geoJSON files or additional territories not supplied with WebFOCUS, change the extension to the correct value and point to where these files are stored.
Note:
- The url attribute points to the location files (the tdgchart
engine included with WebFOCUS has this path configured during WebFOCUS
installation. If you are using geoJSON files, change the extension
to the correct value and point to where those files are stored.
The following code shows how to use the location file sample_ggsales_regsions.geojson, that was installed as a sample during WebFOCUS installation:
url: function() { return tdgchart.getScriptPath().replace(/\/tdg\/.*/,'/web_resource/map/') +'sample_ggsales_regions.geojson'}
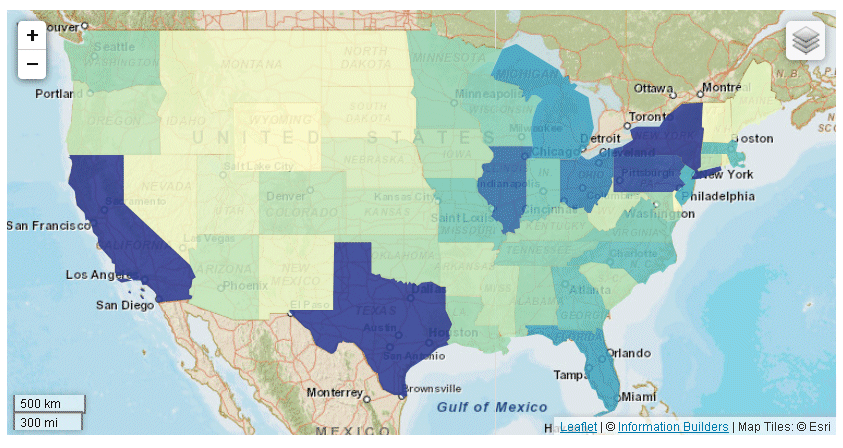
The following request against the statepop data source defines an overlay layer and the layer and scale controls. The type property is set to 'regions' and the dataLookup property is set to 'properties.state_name' because these are the values specified in the location file that match the data in the statepop data source:
GRAPH FILE STATEPOP
SUM POPULATION
BY STATE
ON GRAPH PCHOLD FORMAT JSCHART
ON GRAPH SET LOOKGRAPH CHOROPLETH
ON GRAPH SET STYLE *
*GRAPH_JS
mapProperties: {
engine: 'leaflet',
leaflet: {
initPos: {
center: [37.8, -96],
level: 4
},overlayLayers: [{
title: 'United States of America',
dataLookup: 'properties.state_name',
layerInfo: {
maxZoom: -1,
minZoom: -1,
type: 'regions'
},
type: 'tdg',
url: function(){ return tdgchart.getScriptPath() + 'map/US.json'}
}],
controls: [
    {control: 'L.Control.Layers'},
    {
     control: 'L.Control.Scale',
     options: {
      imperial: true,
      metric: true }
    }
],baselayers: [{
title: "ArcGIS_World_Street_Map",
layerInfo: {
maxZoom: 17,
minZoom: 0,
attribution: function(){ return "&|copy; <a target='_blank' href='http://www.InformationBuilders.com'>Information Builders</a> | " +
"Map Tiles: &|copy; Esri";}
},
url: function(){ return 'http://services.arcgisonline.com/ArcGIS/rest/services/World_Street_Map/MapServer/tile/{z}/{y}/{x}';}
}]
}
},
*END
ENDSTYLE
ENDThe request output is a choropleth on top of the base layer, in which the population ranges are represented by the colors of the polygons representing the different states:
When the mouse hovers over the layer control, the title for each layer displays:
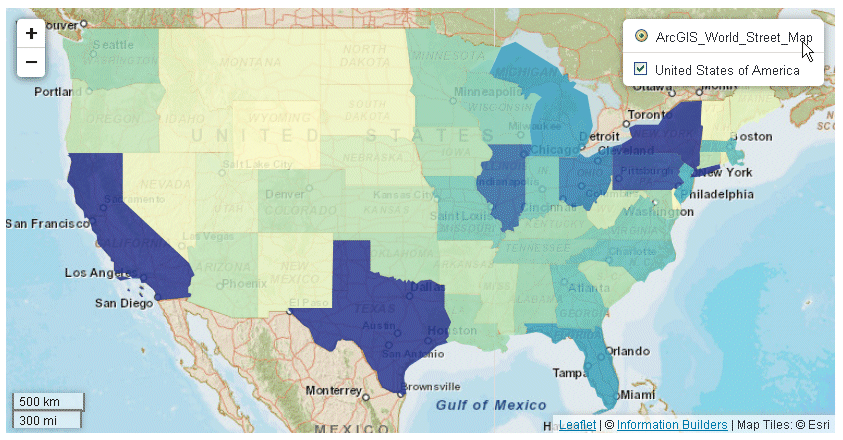
On this choropleth, there is no indication of the population ranges that the colors represent or the actual values for each state. You can add these objects using the legend and tooltip properties.