colorMode: {
   mode: 'mstring',
   colorList: ['cstring',...'cstring']
 },
where:
- 'mstring'
Is a string that defines the chart color mode. Valid values are:
- 'byGroup', in which risers and markers in a group a colored according to values specified in the series:color property.
- 'byHeight', in which the colors defined in the colorList array create a gradient such that the first color is at the numeric axis minimum, the last color is at the numeric axis maximum, and the remaining colors are interpolated between these. This gradient is then used to color the risers. The byHeight mode is only valid for charts with an ordinal axis and a single numeric axis.
- 'byInterpolation', in which the first series is colored the first color in the colorList array, the last series is colored the last color, and the series in between are interpolated accordingly.
- 'byInterpolationAlt', which is identical to byInterpolation, except it does one additional step of mixing up the order of the chosen series colors. This mode is useful because colors between adjacent risers are different and easier to distinguish.
- 'bySeries', in which risers and markers in a series are colored according to the values specified by the series:color property. This is the default, except for pie charts.
- ['cstring',...'cstring']
For byHeight, byInterpolation, and byInterpolationAlt color modes, is an array of colors defined by a color name or numeric specification string. If only one color is specified for byHeight, byInterporation, or byInterpolationAlt, a lighter version of that color is used as an implicit second color. The default value is undefined.
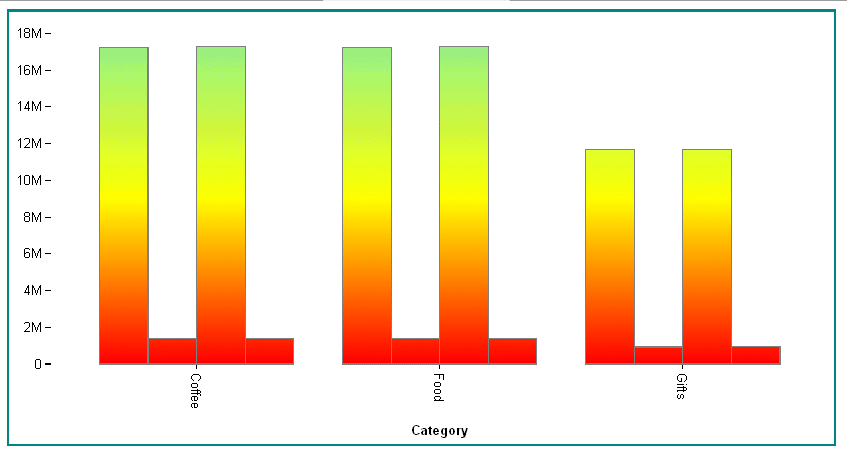
The following request against the GGSALES data source uses the default color mode (bySeries):
GRAPH FILE GGSALES
SUM DOLLARS UNITS BUDDOLLARS BUDUNITS
BY CATEGORY
ON GRAPH PCHOLD FORMAT JSCHART
ON GRAPH SET LOOKGRAPH VBAR
ON GRAPH SET STYLE *
*GRAPH_JS
border:{width:2, color:'teal'},
series: [
{series: 'all', border: {width: 1, color: 'grey'}},
{series: 0, color: 'red'},
{series: 1, color: 'teal'},
{series: 2, color: 'yellow'},
{series: 3, color: 'cyan'},
]
*END
ENDSTYLE
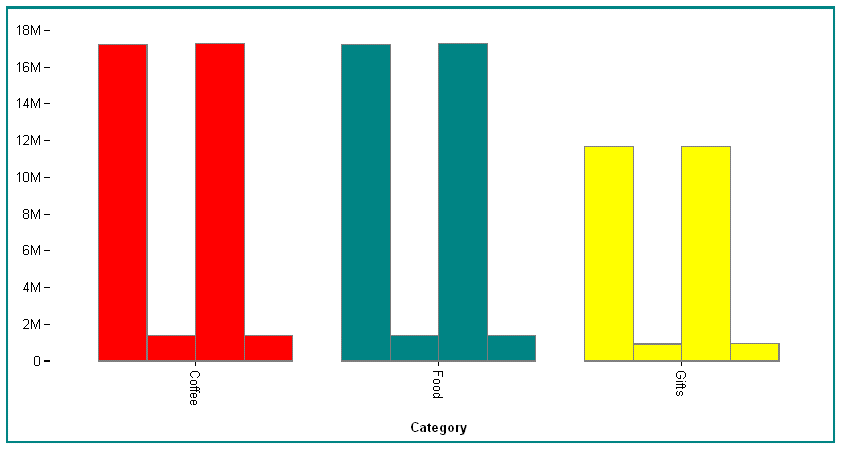
ENDOn the output, each series has its own color, and that color is repeated for each group (CATEGORY):
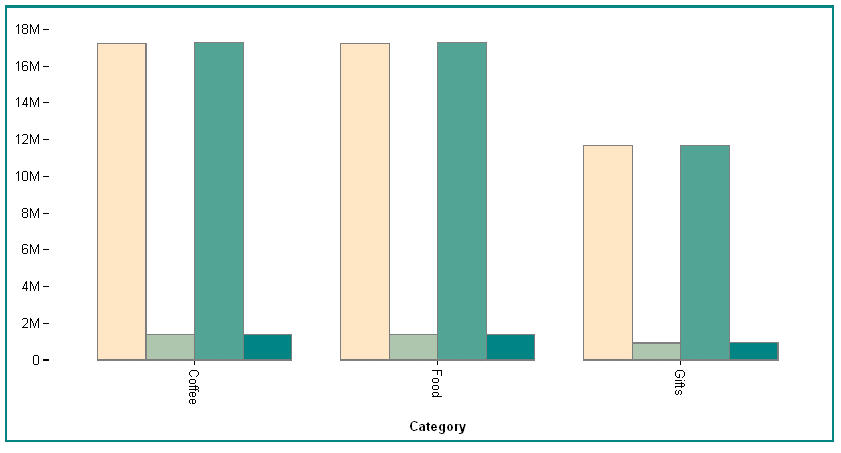
The following version of the request changes the color mode to byGroup:
GRAPH FILE GGSALES
SUM  DOLLARS UNITS BUDDOLLARS BUDUNITS
BY CATEGORY
ON GRAPH PCHOLD FORMAT JSCHART
ON GRAPH SET LOOKGRAPH VBAR
ON GRAPH SET STYLE *
*GRAPH_JS
border:{width:2, color:'teal'},
legend: {visible:false},
  colorMode: {mode: 'byGroup'},
series: [
   {series: 'all', border: {width: 1, color: 'grey'}},
   {series: 0, color: 'red'},
   {series: 1, color: 'teal'},
   {series: 2, color: 'yellow'},
   {series: 3, color: 'cyan'}
]
*END
ENDSTYLE
END
On the output, all series in each group (CATEGORY) are colored the same. Group 0 uses the color set for series 0, group 1 uses the color set for series 1, and so on:
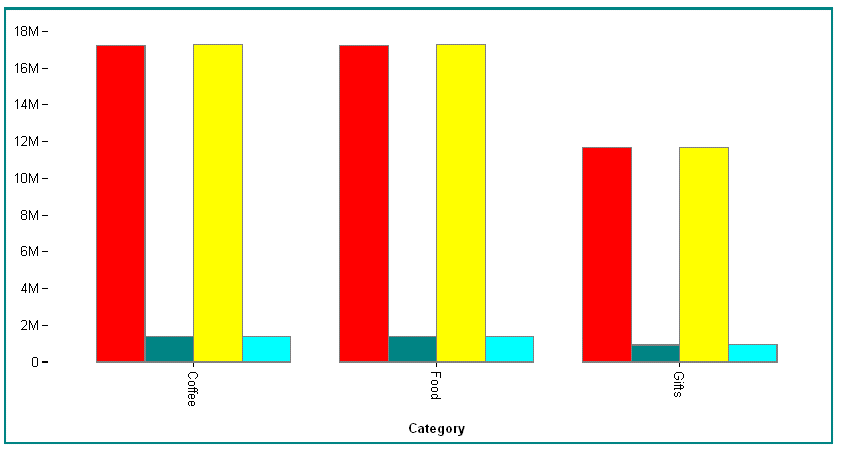
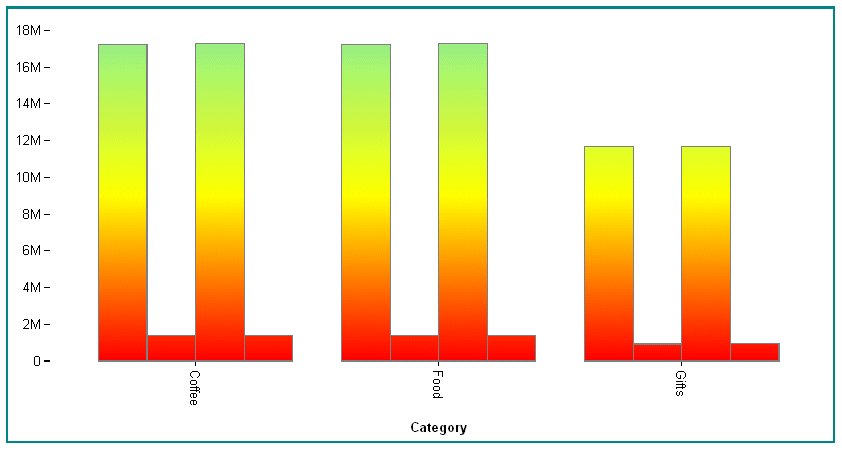
Next, change the color mode to byHeight and add a color list:
colorMode: {
   mode: 'byHeight',
   colorList: ['red', 'yellow','lightgreen']
   }
On the output, the risers are colored using a gradient such that the first color is at the numeric axis minimum, the last color is at the numeric axis maximum, and the remaining colors are interpolated between these:
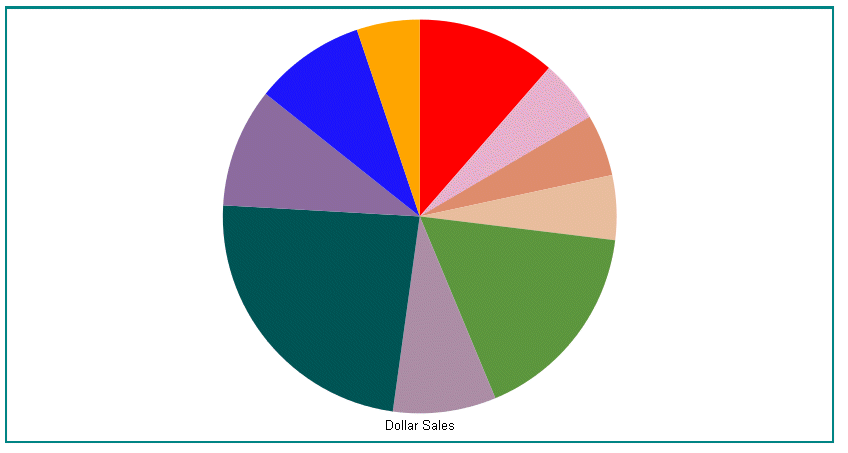
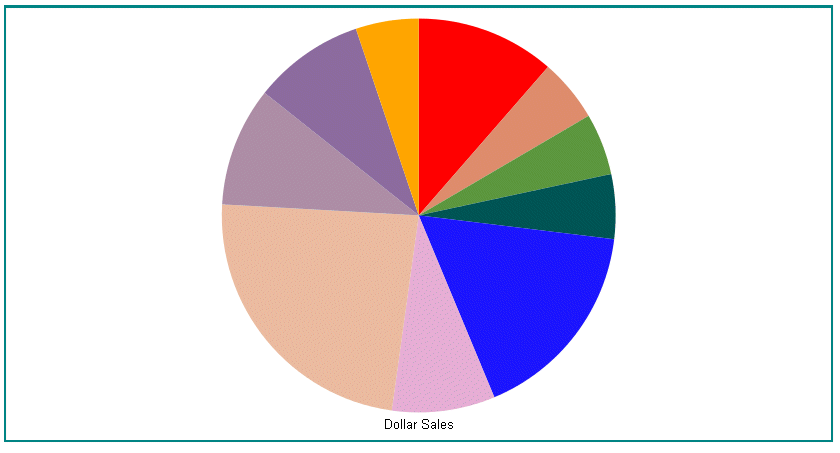
The next request generates a pie chart with the color mode byInterpolation with a color list:
GRAPH FILE GGSALES
SUM DOLLARS
BY PRODUCT
ON GRAPH PCHOLD FORMAT JSCHART
ON GRAPH SET LOOKGRAPH PIE
ON GRAPH SET STYLE *
*GRAPH_JS
border:{width:2, color:'teal'},
legend: {visible:false},
  colorMode: {mode: 'byInterpolation',colorList: ['red','tan', 'green','blue', 'pink', 'burlywood', 'slateblue', 'orange']} ,
*END
ENDSTYLE
END
On the output, the first series is colored the first color in the colorList array, the last series is colored the last color, and the series in between are interpolated accordingly:
Changing the color mode to byInterpolationAlt generates the following chart, in which the colors have been interpolated and shuffled: