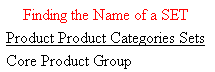
SQL Server Analysis Services (SSAS) Reporting With WebFOCUS

In this section:

Two types of hierarchy are represented in a synonym: level and parent/child:


Top of page

x
Overview of Reporting Concepts

In a multi-dimensional data source (cube), dimensions are categories of data, such as Region or Time, that you use to analyze and compare business performance. Dimensions consist of data elements that are called members. For example, a Region dimension could have members England and France.

Dimension members are usually organized into hierarchies. Hierarchies can be viewed as tree-like graphs where members are the nodes.

For example, the Region dimension may have the element World at its top level (the root node). The World element may have children nodes (members) representing continents. Continents, in turn, can have children nodes that represent countries, and countries can have children nodes representing states or cities. Nodes with no children are called leaf nodes.

Measures are numeric values, such as Sales Volume or Net Income, that are used to quantify how your business is performing.

A multi-dimensional cube consists of data derived from facts, which are records about individual business transactions. For example, an individual fact record reflects a sales transaction of a certain number of items of a certain product at a certain price, which occurred in a certain store at a certain moment of time. The cube contains summarized fact values for all combinations of measures and members of different dimensions.

For example, the following combination (tuple) contains the total volume of sales of pumps in all stores in England in 2005:

{Sales Volume, Pumps, England, 2005}

The point in the cube that contains this summarized value is called a cell. A cell is addressed by a combination of members of different dimensions and a measure. In this example Sales Volume is a measure and Pumps, England, and 2005 are members of the Product, Region, and Time dimensions respectively.

Individual fact records are usually tied to the leaf nodes of each hierarchy in the cube. The fact values get included in cells addressed by these leaf nodes and added to all cells addressed by all combinations of ascendants of these leaf nodes along each hierarchy of the cube.

The operation used to summarize facts for some measures can be a simple sum or a more complex aggregation function such as an average.

Some combinations of hierarchy nodes may not have any fact records tied to them. The cells addressed by these combinations are empty cells.

As illustrated in the previous example, a tuple is a combination of members from different dimensions of a cube. The previous tuple contains members from all dimensions and, therefore, addresses a single cell. If a tuple contains only members from some dimensions, it addresses not just one cell but a whole slice of cells in the cube. For example, the following tuple does not include either Region or Time dimension members:

{Sales Volume, Pumps}

It addresses as many cells in the cube as there are members of the Region dimension times the number of members of the Time dimension.

The number of cells in the cube addressed by a single dimension member is a product of cardinalities of all other dimensions.

When all cells addressed by a member are empty, the member is called an empty member. When all cells addressed by a tuple are empty, the tuple is called an empty tuple.

By default, empty cells do not appear on report output. You can issue the following command if you want them on the report output:

ENGINE SSAS SET EMPTY ON

OLE DB for OLAP (ODBO) defines three basic types of hierarchy structures: balanced, unbalanced, and ragged.

The SSAS implementation of OLAP introduces its own terminology. SSAS hierarchies can be standard or parent-child. This characteristic has more to do with the way the hierarchy is defined rather than with its actual structure. Standard hierarchies are created from relational tables in such a way that each level of the hierarchy corresponds to a column in a relational table (of a column-based expression). Parent-child hierarchies, however, are created from tables having two essential columns. One containing the unique identifier of a member and another containing the identifier of its parent.

Thus, for standard hierarchies, the number of levels is fixed at the time when the hierarchy is defined. For parent-child hierarchies, the number of levels is determined by the contents of tables from which they are created rather than their columnar structure. Therefore, this number may change each time the hierarchy is loaded.

Usually, names of levels of standard hierarchies are inherited from the names of the corresponding relational columns because the data in different columns of a relational table are organized according to its semantics. Data items with the same semantics belong to the same column (for example country names belong to the Country column, city names belong to the City column). Level names of parent-child hierarchies are either automatically generated or assigned by the OLAP administrator, depending on the nature of the hierarchy data because data items in parent-child tables tend to be homogeneous. A list of company employees is a typical example of data that is naturally organized this way.

At the time of creation of a standard hierarchy it is possible to specify the convention for missing members. For example, a NULL value might represent a missing member. For example, a NULL value in the State column in a row of the Geography table containing values 'USA'-NULL-'Washington DC' means that the Washington DC member's parent is USA, which is two levels above it. This mechanism allows creation of standard hierarchies which, from the ODBO point of view, have unbalanced and/or ragged structures.

For parent-child hierarchies, SSAS currently does not provide an option for specifying a missing member. Thus it is currently impossible to create a parent-child hierarchy with a ragged structure. However, parent-child hierarchies typically (but not necessarily) have an unbalanced structure.

This difference between standard and parent-child hierarchies also explains why different levels of a standard hierarchy usually have different sets of user-defined properties, while all levels of a parent-child hierarchy have identical sets of user-defined properties.

When the adapter accesses a multi-dimensional cube, it uses two types of metadata elements about dimensions:

Using the hierarchy fields, the adapter can recreate the hierarchy and locate portions of the hierarchy needed to satisfy a request.


Top of page

x
Understanding Columnar and Hierarchical Reporting

Reference:

Hierarchical reporting enables you to sort and select members of parent/child hierarchies without knowing specific level numbers.

A hierarchical reporting request goes through several phases before output is displayed.

Hierarchical Sorting and Member Selection

The first phase selects hierarchy members to display. The hierarchical reporting phrase BY or ON HIERARCHY automatically sorts and formats a hierarchy with appropriate indentations that show the parent/child relationships. If you do not want to see the entire hierarchy, you can use the WHEN phrase to select hierarchy members for display. The expression in this WHEN phrase must reference only hierarchy fields, not dimension properties or measures.

Measures cannot be used in selecting hierarchy levels for display.

Screening Dimension Data

Members are selected using the WHEN phrase. WHERE and IF phrases are not supported.

Screening Based on Aggregated Values

Measures, being summarized values, can be referenced in WHERE TOTAL tests and COMPUTE commands because those commands are processed after the hierarchy selection and aggregation phases of the request. When screening with WHERE TOTAL, the aggregation phase of the report processing is over, so totals on the report are not recalculated to account for the data that is screened out, the rows are just removed.


x
Reference: Prerequisites for Hierarchical Reporting

Hierarchical reporting uses special metadata attributes and reporting syntax. You must:


Top of page

x
Representing Hierarchies in a Synonym

Dimensions are organized into sets of hierarchies. For example, in a Time dimension, years, quarters, and months can form a hierarchical or parent/child relationship. This means that the measures for each month are aggregated into values for quarters, and the quarters are aggregated into values for years. Each point in the hierarchy is called a node. Nodes at the bottom of the hierarchy (with no children) are called leaf nodes.

In a synonym, hierarchies can be described in one of two ways:

Dimension properties apply to all hierarchies in the dimension and are listed in the synonym following all of the hierarchies.


Example: Dimension Declaration

Each dimension begins with a dimension record that defines the dimension and its hierarchies. The dimension itself is level zero.

Dimension:

DIMENSION=[Employee], CAPTION='Employee', $


Example: Describing a Level Hierarchy

Each level of the hierarchy is assigned a field name consisting of the hierarchy name with the level number appended. Each field declaration also specifies the field name of its parent with the WITHIN attribute. The value stored in this field is the member caption (title).

If a new level appears in the data, the synonym must be recreated to define this new level.

The following field describes level three. Its parent is level 2:

 FIELDNAME=Product_Category, ALIAS='Product Category', USAGE=A20,
      ACTUAL=A20,
      TITLE='Product Category',
      WITHIN='Product_Department',
      PROPERTY=CAPTION,  $


Example: Describing a Parent/Child Hierarchy

Several fields are used to define a parent/child hierarchy. Each has a PROPERTY attribute that describes which hierarchy property it represents. The hierarchy field names are formed by appending a suffix to the hierarchy name.

For example, the caption of a hierarchy named Departments is stored in a field whose name is Departments and whose property attribute is PROPERTY=CAPTION.

The following table describes the hierarchy fields:

Description of Data

PROPERTY=

Field Suffix

Member's Unique ID (unique within the cube)

UID

Member's Name (unique within the hierarchy)

NAME

_name

Member's Level Number

LEVEL_NUMBER

_lvlno

Member's Parent

PARENT_OF

_parent

Parent's Level Number

PARENT_LEVEL_NUMBER

_parent_lvlno

Number of Children

CHILDREN_CARDINALITY

_children_card

Member's Caption (title on reports)

CAPTION

_caption

The following declaration for the Departments hierarchy describes the field that contains a member's unique ID (PROPERTY=UID):

 FIELDNAME=Departments, USAGE=A143, ACTUAL=A143,
      MISSING=ON,
      TITLE='Departments Member Unique Name',
      WITHIN='*[Department].[Departments]',
      REFERENCE=[Department], PROPERTY=UID,  $

The following declaration for the Departments hierarchy defines the field that contains a member's title (PROPERTY=CAPTION):

    FIELDNAME=Departments_caption, USAGE=A60, ACTUAL=A60,
      MISSING=ON,
      TITLE='Departments Member Caption',
      REFERENCE=ADVENTURE_WORKS.Departments, PROPERTY=CAPTION


Example: Dimension Properties

Following all hierarchies, the dimension properties (called attributes) are described. Each of these has PROPERTY=ATTRIBUTE in the synonym.

For example, the following field represents the property occupation in the Customers hierarchy:

 FIELDNAME=Occupation, ALIAS=Occupation, USAGE=A14, ACTUAL=A14,
      MISSING=ON,
      TITLE='Occupation',
      REFERENCE=Customer, PROPERTY=ATTRIBUTE,  $


Example: Sample Request Using a Level Hierarchy

A report request against a level hierarchy must specify the field name for each level of the hierarchy required in the report.

For example, the following request displays the Profit measure for levels 1 through 3 of the Customers hierarchy:

TABLE FILE baseapp/sales 
SUM 
 Profit 
 BY Country AS 'Level1'
 BY State_Province AS 'Level2'
 BY City AS 'Level3'
END

The partial output is:

Level1  Level2  Level3                  ProfitUSA     CA      Altadena     3,345.87690000000
                Arcadia      3,090.86140000000
                Bellflower   3,995.49900000001

In order to get a total for the entire hierarchy, you have to use an ON TABLE COLUMN-TOTAL command in the request or add another SUM command without a BY phrase (and this would add another column to the report output).


Example: Sample Request Using a Parent/Child Hierarchy

A report request against a parent/child hierarchy can use the BY HIERARCHY phrase to report against the entire hierarchy. The output is automatically formatted with appropriate indentations to show the hierarchy levels and relationships.

For example, the following request shows the sales amount measure for three generations of the Organizations hierarchy:

TABLE FILE ADVENTURE_WORKS 
SUM Amount 
BY Accounts_caption HIERARCHY 
SHOW TO DOWN 3
ON TABLE SET PAGE NOPAGE
ON TABLE SET STYLE *
GRID=OFF, $
END

The partial output is:

Accounts Member Caption                Amount
-----------------------                ------
  Balance Sheet                           .00
    Assets                      13,740,731.00
      Current Assets            12,445,628.00
        Cash                     3,236,799.00
        Receivables              3,475,923.00
          Trade Receivables      3,371,580.00
          Other Receivables        104,343.00
        Allowance for Bad Debt      67,429.00
        Inventory                4,143,398.00
          Raw Materials          2,007,586.00
          Work in Process        1,393,582.00
          Finished Goods           742,230.00
        Deferred Taxes             505,424.00
        Prepaid Expenses           341,992.00

The report request does not have to reference specific hierarchy levels. The BY HIERARCHY phrase recreates and formats the hierarchy for display. You can also use a WHEN phrase to select a portion of the hierarchy and a SHOW phrase to specify how many levels above and below the selected portion of the hierarchy you want to display. This display format clearly shows the parent/child relationships between the hierarchy members.

For more information, see Hierarchical Reporting.


Top of page

x
Hierarchical Reporting

How to:

When you issue a request against a cube, some of the requirements and features available depend on the type of hierarchy you are reporting against.

With a parent/child hierarchy, you can specify whether the measure values displayed for each parent should show the sum of all of its descendants (full total) or the sum of its displayed descendants (visual total).

Rollup using the MDX VISUALTOTALS function is a SSAS Adapter feature that enables you to select members using WHERE/IF clauses (for level hierarchies) or WHEN clauses (for parent/child hierarchies), and have the SSAS engine recalculate the values for the displayed members based on the report selection criteria. MDX is the language that is used by the SSAS engine.

For parent/child hierarchies, you can use the BY HIERARCHY phrase to sort and format the hierarchy. You can also limit the portion of the hierarchy selected for display using the WHEN phrase.

When a hierarchical request is processed, the first step is to build the hierarchy and mark which nodes should be included, which should be excluded, and which are needed for context.

The next stage fills the hierarchy with measure values.

Measure values cannot be used to select hierarchy levels for reporting. After the hierarchy rows have been selected, screened, and aggregated, WHERE TOTAL tests can limit the rows displayed based on measure values.


x
Syntax: How to Display Parent/Child Hierarchies

The following syntax can be used to generate hierarchical reports when the synonym defines parent/child hierarchies:

SUM measure_field ...
BY hierarchy_field [HIERARCHY [WHEN expression_using_hierarchy_fields;]
[SHOW [TOP|UP n] [TO {BOTTOM|DOWN m}] [byoption [WHEN condition] ...] ]
.
.
.
[ON hierarchy_field HIERARCHY [WHEN expression_using_hierarchy_fields;]
[SHOW [TOP|UP n] [TO BOTTOM|DOWN m] [byoption [WHEN condition] ...]]

where:

measure_field

Is the field name of a measure.

BY hierarchy_field HIERARCHY

Identifies the hierarchy used for sorting.

ON hierarchy_field HIERARCHY

Identifies the hierarchy used for sorting. The request must include either a BY phrase or a BY HIERARCHY phrase for this field name.

WHEN expression_using_hierarchy_fields;

Selects hierarchy members. The WHEN phrase must immediately follow the word HIERARCHY to distinguish it from a WHEN phrase associated with a BY option (such as SUBFOOT). Any expression using only hierarchy fields or properties is supported. The WHEN phrase can be on the BY HIERARCHY command or the ON HIERARCHY command, but not both.

SHOW

Specifies which levels to show on the report output relative to the levels selected by the WHEN phrase. If there is no WHEN phrase, the SHOW option is applied to the root node of the hierarchy. The SHOW option can be specified on the BY HIERARCHY phrase or the ON HIERARCHY phrase, but not both.

n

Is the number of ascendants above the set of selected members that will have measure values. All ascendants appear on the report to show the hierarchical context of the selected members. However, ascendants that are not included in the SHOW phrase appear on the report with missing data symbols in the report columns that display measures. The default for n is 0.

TOP

Specifies that ascendant levels to the root node of the hierarchy will be populated with measure values.

TO

Is required when specifying a SHOW option for descendant levels.

BOTTOM

Specifies all descendants to the leaf nodes of the hierarchy will be populated with measure values. This is the default value.

m

Is the number of descendants of each selected level that will display. The default for m is BOTTOM, which displays all descendants.

byoption

Is one of the following sort-based options: PAGE-BREAK, REPAGE, RECAP, RECOMPUTE, SKIP-LINE, SUBFOOT, SUBHEAD, SUBTOTAL, SUB-TOTAL, SUMMARIZE, UNDER-LINE. If you specify SUBHEAD or SUBFOOT, you must place the WHEN phrase on the line following the heading or footing text.

condition

Is a logical expression.

Note: To generate a visual total (sum that represents only the displayed members) rather than a full total (value found in the cube), issue the SET ROLLUP_BY_VISUALTOTALS command.

The following examples illustrate hierarchical reporting using the BY HIERARCHY phrase. Note that requests with multiple display commands are not supported.

For information about using the MDX VISUALTOTALS function, see Using the MDX VISUALTOTALS Function and Effect of MDX ROLLUP_BY_VISUALTOTALS Mode on Report Output.


Example: Reporting on a Whole Hierarchy

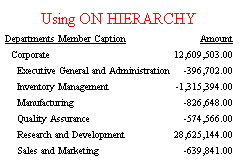
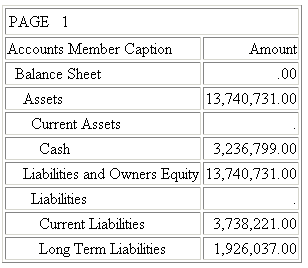
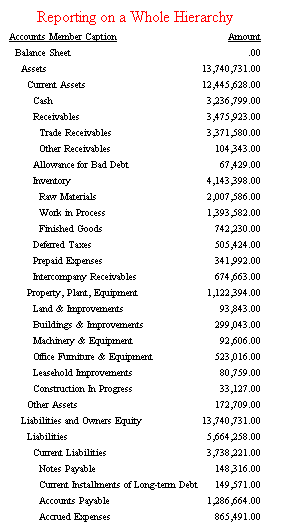
The following request displays the Amount measure for the Accounts hierarchy. The BY HIERARCHY phrase specifies hierarchical reporting. There is no WHEN phrase to limit the portion of the hierarchy displayed:

TABLE FILE ADVENTURE_WORKS
SUM Amount 
BY Accounts_caption HIERARCHY 
ON TABLE SET PAGE NOPAGE
ON TABLE SUBHEAD
"Reporting on a Whole Hierarchy"
ON TABLE SET STYLE *
TYPE=REPORT, SIZE=8,$
TYPE=REPORT, GRID=OFF, WRAP=OFF, $
TYPE=TABHEADING, SIZE=10, COLOR=RED, JUSTIFY=CENTER, $
END

The top portion of the hierarchy is:


Example: Selecting a Hierarchy Member

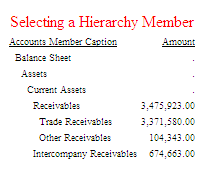
The following request displays the Amount measure for the Accounts dimension, but limits the member selected for display with the WHEN phrase. Note that the hierarchy member selected is displayed in its context (all ancestors to the root of the hierarchy). However, the ancestors are not requested in the report and are, therefore, displayed with missing data symbols. All descendants of the selected members appear in the report output because the default SHOW option for descendants is BOTTOM:

TABLE FILE ADVENTURE_WORKS
SUM Amount 
BY Accounts_caption HIERARCHY
WHEN Accounts_caption CONTAINS 'Receivables'; 
ON TABLE SET PAGE NOPAGE
ON TABLE SUBHEAD
"Selecting a Hierarchy Member"
ON TABLE SET STYLE *
TYPE=REPORT, SIZE=8,$
TYPE=REPORT, GRID=OFF, WRAP=OFF, $
TYPE=TABHEADING, SIZE=10, COLOR=RED, JUSTIFY=CENTER, $
END

The output is:


Example: Selecting a Member and Adding a Parent

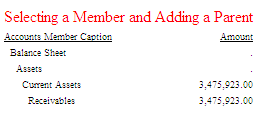
In the following request, the SHOW option UP 1 TO DOWN 0 added to the WHEN phrase adds the parent (Current Assets) of the selected member (Receivables). This parent now contains values for the measure rather than a missing data symbol:

TABLE FILE adventure_works
SUM Amount 
BY Accounts_caption HIERARCHY
WHEN Accounts_caption EQ 'Receivables';
SHOW UP 1 TO DOWN 0  
ON TABLE SET PAGE NOPAGE
ON TABLE SUBHEAD
"Selecting a Member and Adding a Parent"
ON TABLE SET STYLE *
TYPE=REPORT, SIZE=8,$
TYPE=REPORT, GRID=OFF, WRAP=OFF, $
TYPE=TABHEADING, SIZE=10, COLOR=RED, JUSTIFY=CENTER, $
END

The output is:


Example: Selecting a Member and Adding Children

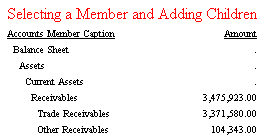
In the following request, the SHOW option UP 0 TO DOWN 1 added to the WHEN phrase adds the children of the selected member (Receivables):

TABLE FILE adventure_works
SUM Amount 
BY Accounts_caption HIERARCHY
WHEN Accounts_caption EQ 'Receivables';
SHOW UP 0 TO DOWN 1  
ON TABLE SET PAGE NOPAGE
ON TABLE SUBHEAD
"Selecting a Member and Adding Children"
ON TABLE SET STYLE *
TYPE=REPORT, SIZE=8,$
TYPE=REPORT, GRID=OFF, WRAP=OFF, $
TYPE=TABHEADING, SIZE=10, COLOR=RED, JUSTIFY=CENTER, $
END

The output is:


Example: Selecting a Member and Showing All Ascendants

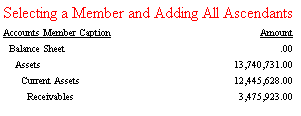
In the following request, the SHOW option TOP TO DOWN 0 added to the WHEN phrase adds all ascendants but no descendants of the selected member (Receivables). These parents now contain values for the measure rather than missing data symbols:

TABLE FILE adventure_works
SUM Amount 
BY Accounts_caption HIERARCHY
WHEN Accounts_caption EQ 'Receivables';
SHOW TOP TO DOWN 0  
ON TABLE SET PAGE NOPAGE
ON TABLE SUBHEAD
"Selecting a Member and Adding All Ascendants"
ON TABLE SET STYLE *
TYPE=REPORT, SIZE=8,$
TYPE=REPORT, GRID=OFF, WRAP=OFF, $
TYPE=TABHEADING, SIZE=10, COLOR=RED, JUSTIFY=CENTER, $
END

The output is:


Example: Selecting a Member and Showing All Ascendants and Descendants

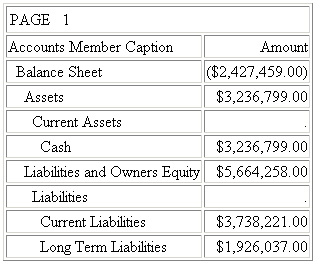
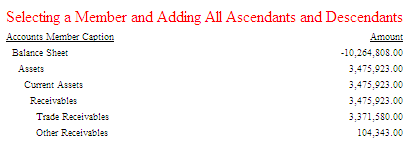
In the following request, the SHOW option TOP added to the WHEN phrase adds all ascendants and descendants (since TO BOTTOM is the default) of the selected member (Receivables). These parents are now in the SHOW set and contain values for the measure rather than missing data symbols:

TABLE FILE adventure_works
SUM Amount 
BY Accounts_caption HIERARCHY
WHEN Accounts_caption EQ 'Receivables';
SHOW TOP  
ON TABLE SET PAGE NOPAGE
ON TABLE SUBHEAD
"Selecting a Member and Adding All Ascendants and Descendants"
ON TABLE SET STYLE *
TYPE=REPORT, SIZE=8,$
TYPE=REPORT, GRID=OFF, WRAP=OFF, $
TYPE=TABHEADING, SIZE=10, COLOR=RED, JUSTIFY=CENTER, $
END

The output is:


Example: Using SKIP-LINE

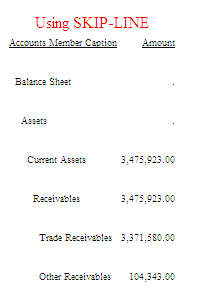
The following request adds the BY option SKIP-LINE to the BY HIERARCHY phrase:

TABLE FILE adventure_works
SUM Amount
BY Accounts_caption HIERARCHY
WHEN Accounts_caption EQ 'Receivables';
SHOW UP 1 TO DOWN 1 SKIP-LINE 
ON TABLE SET PAGE NOPAGE
ON TABLE SUBHEAD
"Using SKIP-LINE"
ON TABLE SET STYLE *
TYPE=REPORT, SIZE=8,$
TYPE=REPORT, GRID=OFF, WRAP=OFF, $
TYPE=TABHEADING, SIZE=10, COLOR=RED, JUSTIFY=CENTER, $
END

The output is:


Example: Using Conditional Sort Options

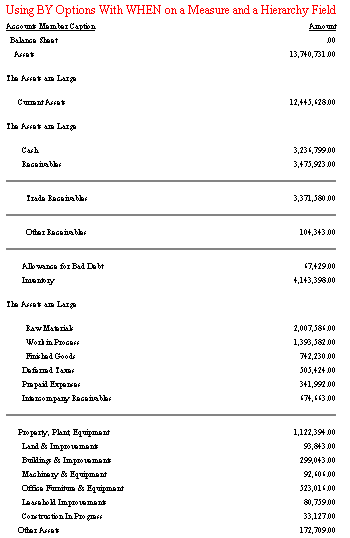
The following request has a BY HIERARCHY command with a WHEN phrase to select members as well as a WHEN phrase to control the UNDER-LINE option.

The SUBFOOT option is in an ON phrase that references the same hierarchy field (all of the BY options could have been on the BY HIERARCHY phrase).

Each BY option has its own WHEN phrase. The WHEN phrase for the SUBFOOT option uses a measure field in its expression. The WHEN phrase for the UNDER-LINE option uses a hierarchy field in its expression. The WHEN phrase that selects members uses a dimension property in its expression.

In this example, one BY option is activated WHEN the Accounts_caption contains Receivables. The other BY option creates a subfoot WHEN Amount is greater than or equal to $4,000,000:

TABLE FILE adventure_works
SUM Amount
BY Accounts_caption HIERARCHY 
WHEN Account_Type EQ 'Assets';
SHOW TOP UNDER-LINE WHEN Accounts_caption CONTAINS 'Receivables';
ON Accounts_caption SUBFOOT 
" "
"The Assets are Large"
" " 
WHEN Amount GE 4000000; 
ON TABLE SUBHEAD
"Using BY Options With WHEN on a Measure and a Hierarchy Field"
ON TABLE SET PAGE NOPAGE
ON TABLE SET STYLE *
TYPE=REPORT, SIZE=8,$
TYPE=REPORT, GRID=OFF, WRAP=OFF, $
TYPE=TABHEADING, SIZE=10, COLOR=RED, JUSTIFY=CENTER, $
END

The output is:


Example: Using Two BY HIERARCHY Phrases

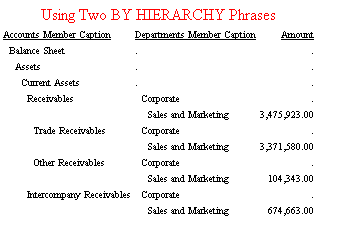
The following request has a BY HIERARCHY phrase for the Accounts hierarchy and a second BY HIERARCHY phrase for the Departments hierarchy (which is from a different dimension, as required). All selected members for the Accounts hierarchy are repeated for each selected member of the Departments hierarchy:

TABLE FILE adventure_works
SUM Amount
BY Accounts_caption HIERARCHY
WHEN Accounts_caption CONTAINS 'Receivables';
BY Departments_caption HIERARCHY 
WHEN Departments_caption CONTAINS 'Sales';
ON TABLE SET PAGE NOPAGE
ON TABLE SUBHEAD
"Using Two BY HIERARCHY Phrases"
ON TABLE SET PAGE NOPAGE
ON TABLE SET STYLE *
TYPE=REPORT, SIZE=8,$
TYPE=REPORT, GRID=OFF, WRAP=OFF, $
TYPE=TABHEADING, SIZE=10, COLOR=RED, JUSTIFY=CENTER, $
END

The output is:


Example: Using BY HIERARCHY and BY Phrases

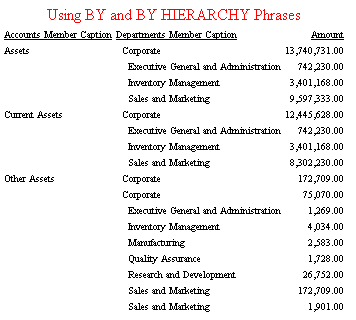
The following request has a BY phrase for the Accounts hierarchy and a BY HIERARCHY phrase for the Departments hierarchy. All selected members for the Departments hierarchy are repeated for each selected member of the Accounts hierarchy (which is not displayed with hierarchical indentations when referenced in a BY phrase). A BY on a unique field is required. WHEN is used to select members for the BY HIERARCHY phrase. WHERE is used to select rows for the BY phrase:

TABLE FILE adventure_works
SUM Amount 
BY Accounts_caption 
BY Departments_caption HIERARCHY 
WHEN Departments_caption OMITS 'Sales';
WHERE Accounts_caption CONTAINS 'Assets' 
ON TABLE SET PAGE NOPAGE
ON TABLE SUBHEAD
"Using BY and BY HIERARCHY Phrases"
ON TABLE SET PAGE NOPAGE
ON TABLE SET STYLE *
TYPE=REPORT, SIZE=8,$
TYPE=REPORT, GRID=OFF, WRAP=OFF, $
TYPE=TABHEADING, SIZE=10, COLOR=RED, JUSTIFY=CENTER, $
END

The output is:


Example: Using ON HIERARCHY Without BY HIERARCHY

The following request has a BY phrase and an ON HIERARCHY phrase for the Departments hierarchy. All hierarchy options and BY options are supported on the ON HIERARCHY phrase. This request also has a WHEN clause that selects members based on the value of a hierarchy field (Departments_caption):

TABLE FILE adventure_works
SUM Amount
BY Departments_caption 
ON Departments_caption HIERARCHY 
WHEN Departments_caption OMITS 'Sales';
ON TABLE SET PAGE NOPAGE
ON TABLE SUBHEAD
"Using ON HIERARCHY"
ON TABLE SET PAGE NOPAGE
ON TABLE SET STYLE *
TYPE=REPORT, SIZE=8,$
TYPE=REPORT, GRID=OFF, WRAP=OFF, $
TYPE=TABHEADING, SIZE=10, COLOR=RED, JUSTIFY=CENTER, $
END

The output is:


Top of page

x
Effect of MDX ROLLUP_BY_VISUALTOTALS Mode on Report Output

In this section:

When reporting against SQL Server Analysis Services (SSAS) cubes, by default, the report output displays the visual totals, not the measure values stored in the cube cells for members that are displayed on the report output. The values displayed are determined by the report selection criteria and dimension levels referenced in the sort phrases (BY and ACROSS) for level hierarchies, or explicit member selection for Parent/Child hierarchies and dimensions not referenced by sort phrases.

To retrieve data from a SSAS cube, the adapter translates the WebFOCUS request to MDX, the language that is used by the SSAS engine. By default, the adapter uses the MDX VISUALTOTALS function. SSAS then returns the requested cells with visual totals.

You can set ROLLUP_BY_VISUALTOTALS OFF if you want values that are aggregates resulting from rolling up measures along the cube dimensions when the cube was processed, and are based on rolling up all the underlying members of the hierarchy even if the report performs some selection on the levels below the displayed ones.

Rollup using the MDX VISUALTOTALS function is a SSAS Adapter feature that enables you to select members using WHERE/IF clauses (for level hierarchies) or WHEN clauses (for parent/child hierarchies), and have the SSAS engine recalculate the values for the displayed members based on the report selection criteria.

To see complete syntax for the SET ROLLUP_BY_VISUALTOTALS command, see Using the MDX VISUALTOTALS Function.


x
Reporting Against Level Hierarchies

Level hierarchies are presented in WebFOCUS synonyms as sets of fields consisting of one mandatory field per hierarchy level (for member captions) and a field per a user-defined property (attribute relationship) associated with the given level. The adapter employs the VISUALTOTALS function when the hierarchy levels referenced in filter conditions (WHERE, IF clauses) are below the levels selected for sort/grouping (BY clauses). The set of members to which the VISUALTOTALS function is applied consists of all the filtered members and their hierarchical ascendants up to (but not above) the lowest level selected for sort/grouping.


Example: Level Hierarchies With Sort/Grouping

Consider the following hierarchy flattened into a table:

Country

State/Province

City

Australia

New South Wales

Coffs Harbour

Australia

New South Wales

Darlinghurst

Australia

New South Wales

Goulburn

Australia

Victoria

Melbourne

Australia

Victoria

Sunbury

Canada

British Columbia

Burnaby

Canada

British Columbia

Cliffside

United States

California

Los Angeles

United States

California

San Francisco

United States

Oregon

Lebanon

United States

Oregon

Portland

United States

Washington

Bellevue

United States

Washington

Seattle

United States

Washington

Spokane

Each row in the table corresponds to a hierarchical path. The following WebFOCUS query selects some paths from the hierarchy using a WHERE clause:

TABLE FILE ADVENTURE_WORKS
WRITE INTERNET_SALES_AMOUNT
BY COUNTRY 
WHERE CITY EQ 'Coffs Harbour' OR 'Darlinghurst' OR 'Melbourne'
OR 'Portland' OR 'Seattle' OR 'Spokane';
END

The following hierarchical paths are selected:

Country

State/Province

City

Australia

New South Wales

Coffs Harbour

Australia

New South Wales

Darlinghurst

Australia

Victoria

Melbourne

United States

Oregon

Portland

United States

Washington

Seattle

United States

Washington

Spokane

The BY COUNTRY phrase determines that members for reporting are selected on the level of Country. The following MDX query is a simplified version of the actual MDX generated by the adapter when ROLLUP_BY_VISUALTOTALS is set to OFF:

Select {[Internet Sales Amount]} on Axis(0),
{[Australia], [United States]} on Axis(1) From [Adventure Works]

The report has the following contents, where the values of the measure Internet Sales Amount are extracted for members Australia and United States as they are rolled up in the cube, not just for the cities selected by the WHERE criteria. This is the default adapter behavior:

For some applications, it is desirable that the values of Country level members shown in the report are not the values that are stored in the cube but rather values rolled up based only on the selected members of City level. In this case, the Internet Sales Amount value of Australia would be the sum of Internet Sales Amount for Coffs Harbour, Darlinghurst, and Melbourne, and the value for United States would be the sum of values for Portland, Seattle, and Spokane.

To do this, the adapter generates an MDX query using the MDX VISUALTOTALS function.

Note that the six selected hierarchical paths form two subtrees. Applying the VISUALTOTALS function to the set of members that form these subtrees and then intersecting the result with the members of the Country level provides the values for Australia and United States rolled up based on the selected cities only. The WebFOCUS request is:

TABLE FILE ADVENTURE_WORKS
WRITE INTERNET_SALES_AMOUNT
BY COUNTRY 
WHERE CITY EQ 'Coffs Harbour' OR 'Darlinghurst' OR 'Melbourne'
OR 'Portland' OR 'Seattle' OR 'Spokane';
END

The following is a simplified version of the MDX query generated by the adapter to achieve the visual total.

Select {[Internet Sales Amount]} on Axis(0),
Intersect(
VisualTotals({[Australia], [New South Wales], [Coffs Harbour], 
[Darlinghurst], 
[Victoria], [Melbourne],
[United States],[Oregon],[Portland],
[Washington],[Seattle],[Spokane]}
), [Customer Geography].[Country].Members) 
on Axis(1) 
From [Adventure Works]

The values that result from this query are not the values for Australia and United States taken from the cube but rather values rolled up by SSAS from the selected cities:


Example: Level Hierarchies With Calculated Measures

The following example shows how visual totals work for calculated measures. The calculated measure [Internet Average Unit Price] is defined by the following expression:

[Internet Unit Price] / [Internet Transaction Count]

where [Internet Unit Price] and [Internet Transaction Count] are measures that are not visible in the Adventure Works cube metadata (and, therefore, the WebFOCUS synonym does not contain corresponding fields for them). Using the MDX VISUALTOTALS function, the following WebFOCUS query returns correct results for the selected countries based only on the selected cities:

TABLE FILE ADVENTURE_WORKS
WRITE INTERNET_AVERAGE_UNIT_PRICE/F12.2
BY COUNTRY 
WHERE CITY EQ 'Coffs Harbour' OR 'Darlinghurst' OR 'Melbourne'
OR 'Portland' OR 'Seattle' OR 'Spokane';
END

The output is:


x
Hierarchical Reporting From Parent-Child Hierarchies

In hierarchical reports, the selected members (specified by WHEN and SHOW clauses) are always shown in their hierarchical context so that the report forms a contiguous subtree (or, if and only if the hierarchy has multiple roots, several subtrees). The values of the requested members are, by default, rolled up, not just extracted from the cube.

The exact set to which the VISUALTOTALS function is applied consists of the members selected by WHEN and SHOW clauses plus connecting members in the hierarchy. WHEN and SHOW clauses may select one or more pairs of members, one of which is an ancestor of another (and the second of which is a descendant of the first) but not the members in between. The adapter calls the VISUALTOTALS function to add all intermediate members connecting these two members to the set to which the VISUALTOTALS function is applied. This is done to ensure its proper functioning. Members below or above this connected set are not added.


x
Reference: Reporting From Parent-Child Hierarchies With BY and WHERE Clauses

Parent-Child hierarchies can be used for regular reporting with BY and WHERE clauses as opposed to BY HIERARCHY and WHEN. In that case, all members of a hierarchy are viewed as a flat stream without any hierarchical relationship. A report shows the selected members in a single column sorted according to the specified BY clause. In this case the notion of visual totals is not applicable.


Example: Retrieving Visual Totals in a Hierarchical Report

Consider the following WebFOCUS hierarchical reporting query:

ENGINE SSAS SET ROLLUP_BY_VISUALTOTALS OFF
TABLE FILE ADVENTURE_WORKS
WRITE AMOUNT
BY ACCOUNTS_CAPTION
HIERARCHY
WHEN ACCOUNTS_CAPTION EQ 'Balance Sheet' 
OR 'Assets' OR 'Liabilities and Owners Equity'
OR 'Cash' 
OR 'Current Liabilities' OR 'Long Term Liabilities';
SHOW UP 0 TO DOWN 0
END

This results in the following report:

To show values of these members not as they are in the cube but rolled up only from its descendants shown in the same report, remove the SET VISUALTOTALS OFF command:

TABLE FILE ADVENTURE_WORKS
WRITE AMOUNT/D12.2BM
BY ACCOUNTS_CAPTION
HIERARCHY
WHEN ACCOUNTS_CAPTION EQ 'Balance Sheet' 
OR 'Assets' OR 'Liabilities and Owners Equity'
OR 'Cash' 
OR 'Current Liabilities' OR 'Long Term Liabilities';
SHOW UP 0 TO DOWN 0
END

The exact set to which the VISUALTOTALS function is applied consists of the members selected by WHEN and SHOW clauses plus connecting members. WHEN and SHOW clauses may select one or more pairs of members one of which is an ancestor of another but not the members in between (Assets and Cash in the following output). The adapter adds all intermediate members connecting these two members to the set to which the VISUALTOTALS function is applied. This is done to ensure its proper functioning. Members below or above this connected set are not added:


x
Reporting Without Sort/Grouping

The VISUALTOTALS function is applied to the set consisting of all ascendants of the selected members and then extracting their lowest common ancestor.

If selected members do not have common ancestors, the adapter creates one by applying function AGGREGATE to the ancestors of the selected members on the topmost level of the hierarchy. This aggregate value is then displayed on the report output.


Example: Reporting Against Hierarchies Without Sort/Grouping

Consider the following WebFOCUS query:

TABLE FILE ADVENTURE_WORKS
WRITE INTERNET_SALES_AMOUNT
WHERE COUNTRY EQ 'Canada' OR STATE_PROVINCE EQ 'Washington';
END

The default behavior results in the combined value of both Canada and Washington members.

Since the selected members do not have common ancestors, with visual totals on, the adapter creates one by applying function AGGREGATE to the ancestors of the selected members on the topmost level of the hierarchy. This aggregate value is then displayed on the report output:

In this example, the generated MDX is equivalent to the following:

Select {[Internet Sales Amount]} on Axis(0),
Intersect(
VisualTotals({[Customer].[Customer Geography].[(All)], 
[Canada], 
[United States], 
[Washington]})
, [Customer Geography].[(All)].Members) 
on Axis(1) 
From [Adventure Works]

Adding the SET ROLLUP_BY_VISUALTOTALS OFF command results in the following report in which the values are shown separately for Canada and Washington:


Top of page

x
Reporting on SQL Server Analysis Services (SSAS) Sets

How to:

A named set is a group of members from one or more hierarchies. WebFOCUS supports named sets in which the members all come from a single hierarchy. When you create a synonym, for each hierarchy that has one or more single-hierarchy named sets, a field with a _SETS suffix is generated. The value stored in this field is the name of one or more sets defined for the associated hierarchy. A SETS field has the attribute PROPERTY=SETS.

You can find the name of a set by printing the value of its associated field. When a SETS field is used in a PRINT command, it must be the only active field in the TABLE request. Once you know the name of a set, you can use it in:

An expression referencing a named set can only consist on EQ and NE conditions. The EQ condition selects all members of the set, and the NE condition excludes all members in the set.

Note: In order to issue a request that performs a selection on a SET, the ROLLUP_BY_VISUALTOTALS parameter must be set to OFF.

Set members can come from different levels in a hierarchy. If a WHERE or SHOW condition limits the portion of the hierarchy being displayed on the report output, only the set members applicable to those hierarchy levels are shown.


x
Syntax: How to Select or Exclude Set Members

For columnar reporting use the following type of expression in one or more WHERE or IF clauses. For hierarchical reporting, use the following type of expression in a WHEN clause:

{WHERE|WHEN} field1_SETS {EQ|NE} setname11 [OR setname12 ...]  
      [{AND|OR} field2_SETS {EQ|NE} setname21 [OR setname22]... ]
IF field1_SETS {EQ|NE} setname11 [OR setname12 ...]  
IF field2_SETS {EQ|NE} setname21 [OR setname22 ...]

where:

field1_SETS

Is a field name with the _SETS extension that contains the names of one or more sets defined for a hierarchy.

setname11, setname12, setname21, setname22

Are the names of sets. The set names setname11 and setname12 are stored in field1_SETS. The set names setname21 and setname22 are stored in field2_SETS.

EQ

Selects members of the associated set.

NE

Excludes members of the associated set.


Example: Finding the Name of a Set

The following request finds the sets defined for the Products hierarchy by printing the value of its SETS field (Product_Product_Categories_SETS):

TABLE FILE adventure_works
PRINT Product_Product_Categories_SETS
ON TABLE SET PAGE NOPAGE
ON TABLE SUBHEAD
"Finding the Name of a SET"
ON TABLE SET STYLE *
TYPE=REPORT, GRID=OFF, WRAP=OFF, $
TYPE=TABHEADING, SIZE=10, COLOR=RED, JUSTIFY=CENTER, $
END

The output shows that the only set defined for this hierarchy is named Core Product Group:


Example: Selecting Members of a Set

The following request selects the members of the Core Product Group set from the Products hierarchy. It further limits the output with a WHERE clause on the Category1 field. ROLLUP_BY_VISUALTOTALS is not supported with this type of query:

ENGINE SSAS SET ROLLUP_BY_VISUALTOTALS OFF
TABLE FILE adventure_works
SUM Internet_Sales_Amount
BY Category1
BY Subcategory1
BY Product 
WHERE Product_Product_Categories_SETS EQ 'Core Product Group'  
WHERE Category1 EQ 'Clothing'
ON TABLE SET PAGE NOPAGE
ON TABLE SUBHEAD
"Reporting on a Set"
ON TABLE SET STYLE *
TYPE=REPORT, SIZE=8,$ 
TYPE=REPORT, GRID=OFF, WRAP=OFF, $
TYPE=TABHEADING, SIZE=10, COLOR=RED, JUSTIFY=CENTER, $
END

The output is:


Top of page

x
Reporting on Key Performance Indicators

Reference:

If a Microsoft SQL Server Analysis data source has Key Performance Indicators (KPIs) defined, you can access and display these performance measures in a WebFOCUS report.

A KPI is a calculation or set of calculations against measures in the cube that typically represent a value, status, trend, or goal. It is stored with properties that enable the organization to set and track progress toward a specified level for the KPI goal. The KPI Value represents the current state of the indicator, and the KPI Goal represents the state toward which the organization is aiming. The KPI Status and KPI Trend are derived by comparing the Goal with the Value.

If the cube has KPIs defined, any synonym created will automatically contain metadata for those KPIs.


x
Reference: KPI Metadata in a Synonym

The metadata for a KPI starts with the following KPI declaration in the Master File:

KPI=kpiname,
   CAPTION=kpi_caption,
   KPI_STATUS_ICON='kpi_status_graphic', 
   KPI_TREND_ICON='kpi_trend_graphic'
   [,PARENT=kpi_parent_kpiname] ,$ 

where:

kpiname

Is the name of the KPI.

kpi_caption

Is the caption for the KPI.

kpi_status_graphic

Is the graphic assigned to the KPI Status property.

kpi_trend_graphic

Is the graphic assigned to the KPI Trend property.

kpi_parent_kpiname

If the KPI is part of a hierarchy of KPIs, this is the name of the parent KPI.

Field declarations describing the KPI properties follow the KPI declaration. Only the VALUE field is required, the GOAL, STATUS, and TREND fields are optional.

The following field declaration describes the KPI Value property and is required:

FIELDNAME=kpiname_KPI_VALUE, 
   ALIAS='[Measures].[kpiname]', USAGE=Ann, ACTUAL=Ann, MISSING=ON,
   TITLE='kpi_value_title', 
   REFERENCE='kpiname', 
   PROPERTY=KPI_VALUE, $ 

where:

kpiname_KPI_VALUE

Is the field name for the KPI Value property.

kpiname

Is the name of the KPI.

kpi_value_title

Is the column title for the KPI Value field.

The following field declarations represent the KPI Goal, Status, and Trend properties. One or more of them may be present, but they are not required:

FIELDNAME=kpiname_KPI_GOAL, 
   ALIAS='[Measures].[kpiname]', USAGE=Ann, ACTUAL=Ann, MISSING=ON,
   TITLE='kpi_goal_title', 
   REFERENCE='kpiname', 
   PROPERTY=KPI_GOAL, $ 
FIELDNAME=kpiname_KPI_STATUS, 
   ALIAS='[Measures].[kpiname]', USAGE=Dn.m, ACTUAL=D8, MISSING=ON,
   TITLE='kpiname_status_title', 
   REFERENCE='kpiname', 
   PROPERTY=KPI_STATUS, $ 
FIELDNAME=kpiname_KPI_TREND, 
   ALIAS='[Measures].[kpiname]', USAGE=Dn.m, ACTUAL=D8, MISSING=ON,
   TITLE='kpiname_trend_title', 
   REFERENCE='kpiname', 
   PROPERTY=KPI_TREND, $ 

where:

kpiname_KPI_GOAL, kpiname_KPI_STATUS, kpiname_KPI_TREND

Are the field names for the KPI Value, Status, and Trend properties.

kpiname

Is the name of the KPI.

kpi_goal_title, kpi_status_title, kpi_trend_title

Are the column titles for the KPI Goal, Status, and Trend fields.


Example: Sample Growth in Customer Base KPI for the Adventure Works Cube

The following declarations define the Growth in Customer Base KPI for the Adventure Works cube:

KPI=Growth in Customer Base, 
   CAPTION='Growth in Customer Base', 
   KPI_STATUS_ICON='Road Signs', 
   KPI_TREND_ICON='Standard Arrow', $ 
FIELDNAME=Growth_in_Customer_Base_KPI_VALUE, 
   ALIAS='[Measures].[Growth in Customer Base]', USAGE=A20, ACTUAL=A20, MISSING=ON, 
   TITLE='Growth in Customer Base Value', 
   REFERENCE='Growth in Customer Base', 
   PROPERTY=KPI_VALUE, $ 
FIELDNAME=Growth_in_Customer_Base_KPI_GOAL, 
   ALIAS='[Measures].[Growth in Customer Base Goal]', USAGE=A20, ACTUAL=A20, MISSING=ON, 
   TITLE='Growth in Customer Base Goal', 
   REFERENCE='Growth in Customer Base', 
   PROPERTY=KPI_GOAL, $ 
FIELDNAME=Growth_in_Customer_Base_KPI_STATUS, 
   ALIAS='[Measures].[Growth in Customer Base Status]', USAGE=D5.2, ACTUAL=D8, MISSING=ON, 
   TITLE='Growth in Customer Base Status', 
   REFERENCE='Growth in Customer Base', 
   PROPERTY=KPI_STATUS, $ 
FIELDNAME=Growth_in_Customer_Base_KPI_TREND, 
   ALIAS='[Measures].[Growth in Customer Base Trend]', USAGE=D5.2, ACTUAL=D8, MISSING=ON, 
   TITLE='Growth in Customer Base Trend', 
   REFERENCE='Growth in Customer Base', 
   PROPERTY=KPI_TREND, $ 


Example: Sample Request Using the Growth in Customer Base KPI

The following request displays the Growth in Customer Base KPI value by fiscal year:

TABLE FILE ADVENTURE_WORKS 
WRITE GROWTH_IN_CUSTOMER_BASE_KPI_VALUE/A6 
BY FISCAL_YEAR 
END 

The output is:

Fiscal Year Growth in Customer Base Value 
----------- ----------------------------- 
FY 2003     0.4605 
FY 2004     4.4040 
FY 2005     -0.946 

iWay Software