Selecting and Joining Data Sources
Your first task is to specify the operational data sources
from which you will be extracting and moving data. You will be adding
two data sources to the data flow and joining them. In one of the
data sources, you will create a virtual column, called a source transformation
in DataMigrator terminology. This transformation will exist only
in the data flow object where you build it.
- In the DMC
navigation pane, expand the ibisamp application
directory.
- On the Home
tab, in the Filter group, click Synonyms.
- Scroll down
to the files that begin with the letters dm.
All of these files were created in the data adapter of your choice
when you choose Create Sample Procedures and Data (see Create Sample Data and Metadata and Create an Application Directory).
You
will be using three synonyms from this group. Synonyms are used
to describe both data sources and data targets. The first two are
used for data sources and the last one for a data target:
dminv
dmord
dmrpts
Tip: At many sites, data sources and data targets are
on different servers and platforms. For this tutorial, we have chosen
the simplest, most universal configuration. For information about
different configuration options, see Remote Server Setup At a Glance and Planning a DataMigrator Application.
xAdd Your First Data Source
You will start by selecting the synonym for the inventory
table called dminv from the expanded ibisamp
directory.
- Drag dminv from
the ibisamp application directory into the Data Flow workspace to
the left of the SQL object.
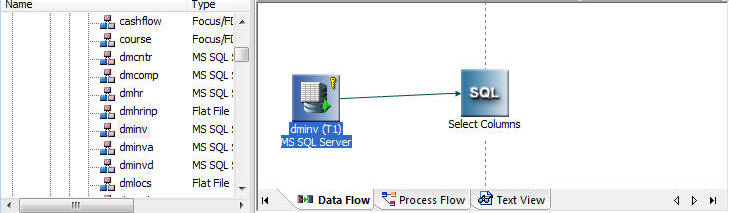
A
connecting arrow is automatically added between these objects.
Tip: If
you drag a synonym object to the left of the SQL object, it is understood
to be a data source. If you drag it to the right of the SQL object,
it is understood to be a data target.
- Let us take
a quick look at the data in the table you selected. By default,
you can retrieve 50 rows from the server to verify that this is
the correct table and that the data is available.
Right-click
the dminv object in the workspace and select Operations,
then Sample Data.
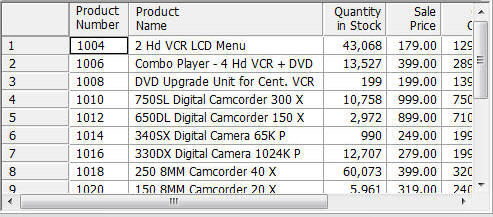
The
information has been retrieved so you know the data source is available.
Close the sample window by clicking the X in
the tab above it.
xAdd and Join a Second Data Source to the First
To add another data source to
the flow:
- Right-click
in the workspace to the left of the SQL object and choose Add
Source. The Select Synonym dialog box opens.
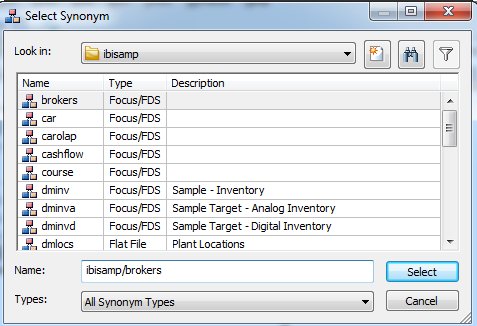
If
the ibisamp directory is not selected in the Look in: field, select
it from the drop-down menu.
- Scroll down
and select the order table called dmord,
then click Select. (You can also drag dmord
from the navigation pane, as you did earlier with dminv.)
The
dmord source object is now connected to the dminv source object
by way of a join object, which is linked to the SQL object.
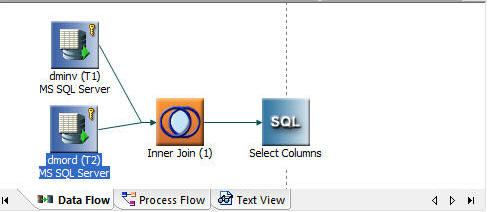
Tip: The
connecting arrows between these objects are added because the option Automatically
add join conditions is selected by default. If these
connections are not appearing on your screen, go the Tools menu
and choose Options, then click the Data
Flow Designer link and select Automatically
add join conditions.
- Let us verify
the data in the orders table using a different method.
Right-click
the dmord source object and select Toggle.
The Columns tab shows the columns in the data source.
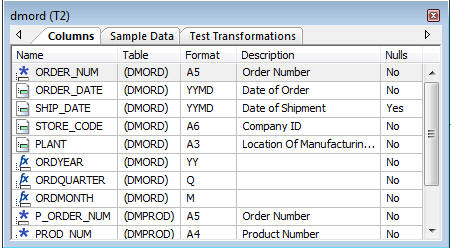
Click
the Sample Data tab to verify that data is
being retrieved from the orders table.
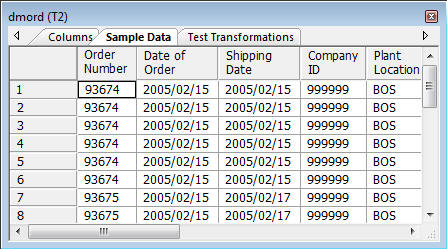
The
first 50 rows are retrieved.
Tip: You can change the
number of rows to retrieve from the Tools group. On the Home tab,
in the Tools group, click Options. From the Tools
dialog box, click the Run Options link, then
change the number in Maximum number of rows for test
reports.
- Double-click
the title bar or click the X in the upper-right corner
to close the window and return to the object view.
Note: You
can also double-click a source object and select the Sample
Data button in the Source Transformations window. Right-clicking
a source object and selecting Operations,
then Sample Data will place the sample data
in the workspace.
xCreate A Virtual Column in the Second Data Source
Shortly, we will take a closer look at the join you
created. But first, you will create a virtual column in the dmord
source object, this is also called a source transformation. Data
transformations in a source object are performed when the records
are read, before any filtering or aggregation occurs.
Planning ahead a bit, you know that the time frame for the data
target you will be creating is the year and month. To facilitate
the mapping of source to target data, you decide to create a virtual
column called YEARMONTH in the dmord data source, to be derived
using the expression YEAR x 100 + MONTH. This column will represent
both the year and the month.
- Double-click
the dmord source object. (You could also
right-click the dmord source object and select Source
Transformations.) The Source Transformations window displays
all of the columns in the data source.
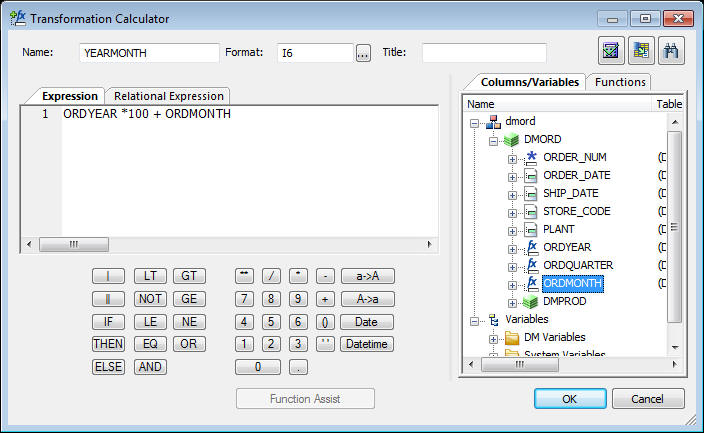
- To define the
virtual column, click the Insert transforms
 button.
 The
Transformation Calculator opens.
- In the Name
box, type YEARMONTH.
- In the Format
box, type I6 (I as in integer).
- Double-click ORDYEAR in
the Columns/Variables tab.
- Click the multiplication
sign (*) on the calculator keypad.
- Type 100
+ in the Expression box.
- Double-click ORDMONTH.
The
calculator should look like this:
Tip: Before
you close the calculator, notice that the two columns you used in
the expression are themselves virtual fields (or transformations)
that were defined directly in the synonym.
Virtual columns
are identified by the symbol  . Adding a virtual column in a
synonym is a useful strategy when you expect to use the same synonym
with more than one flow. For details about adding virtual columns
in a synonym, see Adding Virtual Columns (DEFINE) in a Synonym.
. Adding a virtual column in a
synonym is a useful strategy when you expect to use the same synonym
with more than one flow. For details about adding virtual columns
in a synonym, see Adding Virtual Columns (DEFINE) in a Synonym.
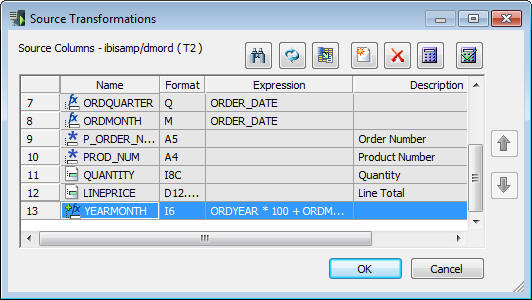
- Click OK to
close the calculator and return to the Source Transformations window.
Notice
that YEARMONTH now appears in the Source Columns list.
- To verify that
the transformation is working properly, click the Test Transforms
 button.
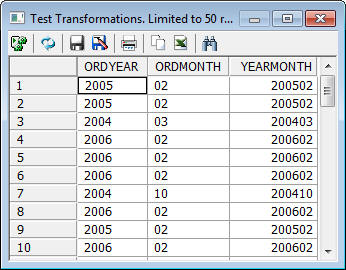
- You will now
be able to use YEARMONTH as source data.
Close the Test Transformation
window, then click OK to close the Source
Transformations window.
x
Now let us consider the join object, which was added
automatically when you selected the second data source. You will
need to specify properties for the join.
By default, an inner join is created. An inner join extracts
those rows that appear in both tables. You will base the join on
an equality condition between two fields, one in each data source.
The use of an equality condition is also called an equi-join.
Tip: Although not illustrated in this tutorial, DataMigrator
supports multiple joins, joins based on conditions other than equalities,
and joins that are modified by calculations, such as substrings
or concatenations. A Join Calculator is available to assist you.
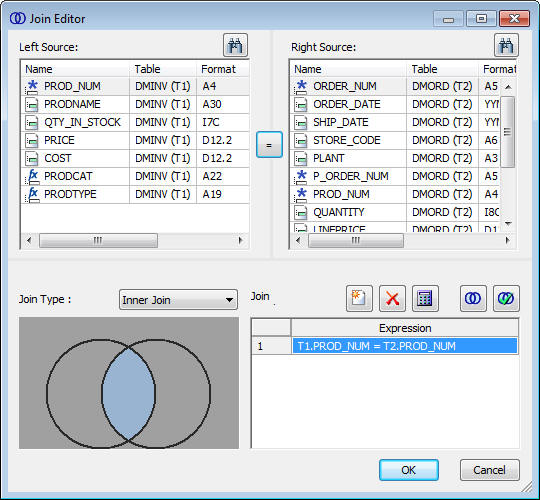
- Right-click
the join object and select Join Editor. The Join
Editor window opens.
- The join must
be based on columns in each of the joined data sources. Notice that PROD_NUM is
in both Left and Right Source Columns lists. The join of T1.PROD_NUM
and T2.PROD_NUM appears in the Expression field of the Join Conditions
list. For the tutorial, the default join on PROD_NUM is sufficient.
Tip: Once
again, the automatic join condition is in effect because the option Automatically
add Join conditions is selected by default. If this
is not the case, on the Home tab, in the Tools group, click Options.
In the Options dialog box, click the Data Flow Designer link
and select Automatically add Join conditions.
The
inner join relationship is reflected in the Expression box and represented graphically
by the overlapping area in the Join Type diagram.
Tip: If
you wanted to change the type to a right or left outer join, you
could simply click the left or right circle. Try that now if you
like, then return to the inner join position. For details about
join options, see Joining Data Sources.
- Click OK to
close the Join Editor window.
Next step: You have now set up your source data. You are
ready to select the columns from the Source data to load into the
data targets, which you will create shortly. To select and structure
the columns, you will be using the SQL object mentioned earlier.