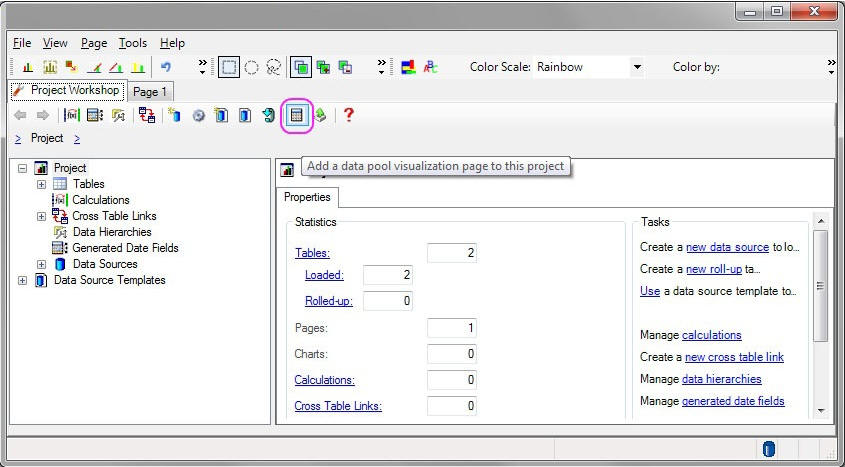
The Data Pool Visualization is a page that shows the
memory usage of the Data Pool, the in memory data storage for WebFOCUS
Visual Discovery. The visualization is launched from the “Data Pool
Visualization” button on the Project Workshop toolbar.
A new tab is created, named Data Pool, which looks the image
below.
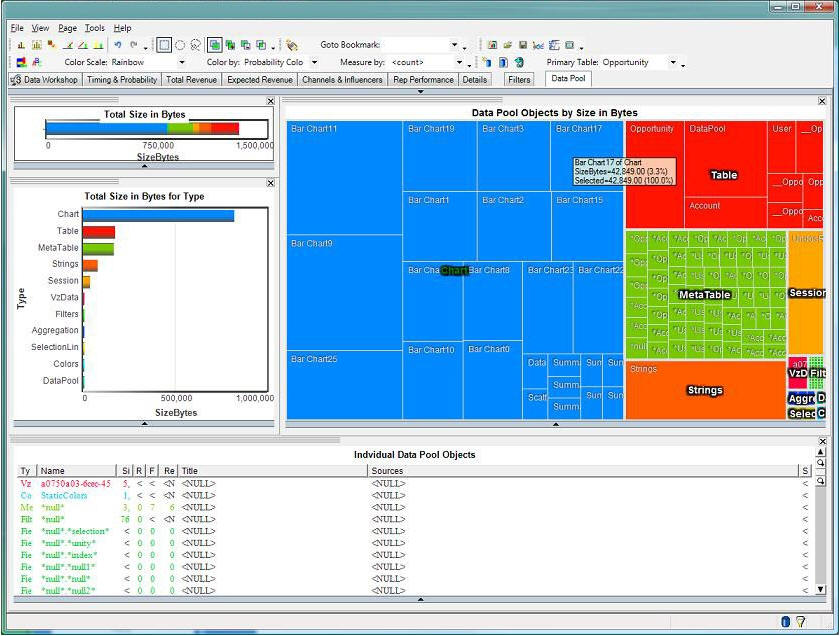
The charts on the display give:
- The Total Size of the Data Pool in bytes (Bar Chart).
- Size by type of the data (Bar Chart).
- Detail on Data Pool Object (Data Sheet)
- Data Pool objects by type and size (Heat Map).
Data Pool Components
The components of the Data Pool displayed are:
- Charts: working memory used by charts. Chart memory is only
allocated when the page containing the chart is visited; untouched
pages take no chart memory.
- Tables: tables storing user data being visualized in the dashboard,
shared by all charts.
- MetaTables: small tables used to store distinct string values
used by fields. There is one MetaTable for each string field.
- Strings: the collection of all distinct strings.
- Session: undo state.
- VzData: overhead.
- Filters: storage for Text Filters.
- Aggregation: sables created by Aggregation Links or by Summary
Sheets.
- SelectionLinks: storage used to match tables connected by Selection
Links.
- Colors: storage of overall color information.
- DataPool: overhead.
Uses
The Data Pool visualization can be used in these ways:
- Use the Total Size in Bytes bar chart to find the overall
size of the Data Pool.
- Look for charts taking excessive memory. This is often from
Bar Charts with too many categories. Consider replacing with Summary
Sheet or eliminating.
- Find the number of distinct strings in the data. If strings
takes a large amount of memory, consider whether they need to be
loaded.
- Find unused fields.
Data Pool Object Fields
These fields are used to describe objects in the Data Pool:
- Type: class of data.
- Name: instance name. For charts, the name is an internal name
that is not externally visible; use the “Title” field to find the
chart.
- SizeBytes: memory used in bytes. The size of Fields is omitted
and included in the table size.
- Rows: Rows in the object for tables; for Strings, the number
of distinct strings.
- Fields: Number of fields for Tables.
- References: Times the object is referenced. Tables and Fields
are referenced by charts. A Field with a reference count of 1 is
unused (it is always referenced by the Table it is in).
- Title: visible title for a chart.
- Sources: the source table.field for charts and links.
- Sinks: the destination table.field for links.