Filtering and Highlighting Data
In this section: How to: Reference: |
You can apply operators to your report data so that you either
filter or highlight data based on criteria you define. You can apply
multiple filters to a report and you can apply filters to filtered
data. If your active dashboards contain multiple reports, you can
apply a global filter to all reports. A global filter is a filter
that is applied to reports that contain the column you are filtering
on.
Operators include:
-
Equals. Equals
a specific value or values. If you select more than one value, OR
logic is used to retrieve records.
-
Not equal. Does
not equal a specified value.
-
Greater than OR
Greater than or equal to. Greater than or greater than or equal
to a specific value.
-
Less than OR Less
than or equal to. Less than or less than or equal to a specific
value.
-
Between. Between
a set of values.
-
Contains OR Contains
(match case). Finds values that include a character string you
specify. The string can occur in any position in the value you are
testing. You can use this option for case-insensitive (Contains)
and case-sensitive strings (Contains (match case)).
-
Omits OR Omits
(match case). Finds values that do not include a character string
you specify. You can use this option for case-insensitive (Omits)
and case-sensitive strings (Omits (match case)).
x
Procedure: How to Filter or Highlight Data in an Active Technologies Report
-
Click the
arrow in the heading of the column you want to filter on. Click Filter and
then the operation.
The Filters Selection dialog box opens. You can change
the operation after you select it.
-
Enter a
value or values, depending on the operation you select.
Values are entered, either by typing a value in a text
box, or selecting a value from a drop-down list.
-
Click Add
Condition if you want to enter additional filters.
If you are adding additional filters, you can apply either
AND or OR logic. AND logic considers all filters and all data must
pass all filters in order to be included in the report output. OR
logic considers filters independently and includes data that meets
any of the applied filters in the report output.
-
Click Filter or Highlight.
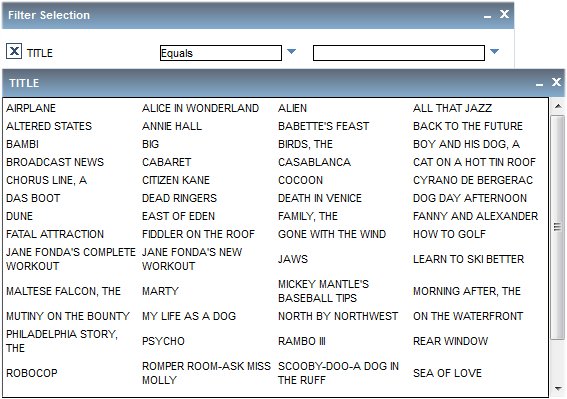
Once
you apply a filter or highlight, and minimize the selection dialog
box, the selection dialog box appears as a button (Filter Selection
or Highlight Selection) in the bottom of the window. You can click
the button to access the dialog box. If you close the dialog box,
all filters and highlights clear from the report output.
x
Procedure: How to Remove Filters or Highlighting
In
the Filter Selection dialog box, click the X adjacent to the filter
or highlight you want to remove. To remove all filters or highlights,
click Clear All.
Also note that if
you close the Filter Selection dialog box, all filters clear from
the report output.
x
Procedure: How to Filter Selections Using Multiple Values
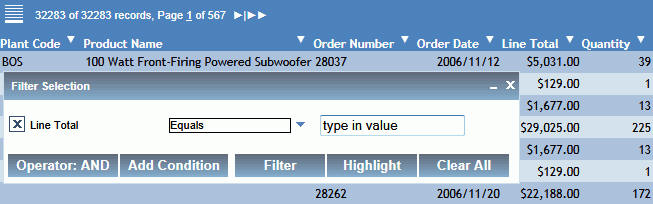
When
you select a value in the Filter Selection dialog box, a value selection
dialog box displays if there are more than 20 data values. Additionally,
when items are selected in the value selection dialog box, the item
is highlighted and checked to indicate the selection.
Selecting multiple values is available
for Equals and Not Equal conditions.
-
Click the
arrow in the heading of the column you want to filter on. Click Filter and
then the operation.
The Filter Selection dialog box opens.
-
Enter a
value or values, depending on the operation you select.
Values are entered either by typing a value in a text box
or selecting a value from a drop-down list.
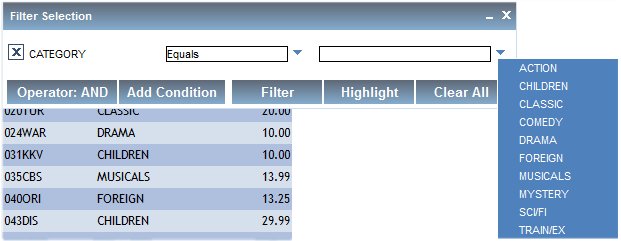
If there are more than 20 data values for the column,
a value selection dialog box opens, as shown in the image below.
For more information about selecting values to be filtered, see Usage Notes for Selecting Values.
-
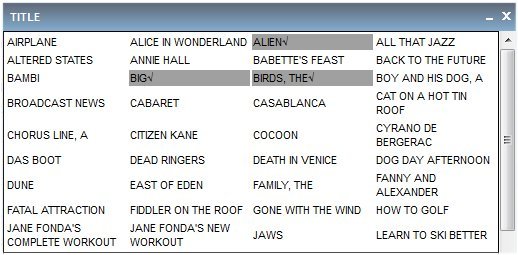
Select a
value, or values, in the value selection dialog box.
The items selected are highlighted and checked, as
shown in the following image.
While
the value selection dialog box appears for both alphanumeric and
numeric data, indicated selections only appear for alphanumeric
data.
-
Close the
value selection dialog box to add your selections to the Filter Selection
dialog box.
-
Click Filter to
apply the filter to the report.
x
Reference: Usage Notes for Filtering Data
The following
apply when filtering data:
- Filtering
data in the Scientific Notation format is not supported.
- Applying
a filter to an active report with a calculation applied to a numeric
column correctly displays the filtered percentage. The filtered
percentage does not appear for non-numeric columns.
-
If no records are returned after applying
a filter, the Status Bar states Page 1 of 1 and, for example, 0
of 10 records.
x
Reference: Usage Notes for Selecting Values
The
following apply when selecting values to be filtered:
x
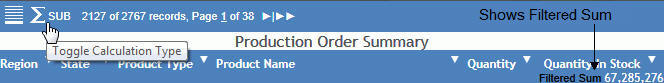
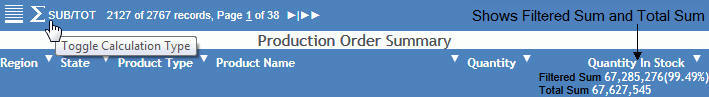
Procedure: How to Toggle Calculation Types for Filtered Data
When
a filter is applied to a report with calculations, the report refreshes
and the calculated column total shows the value for the filtered
data. A calculation icon appears on the pagination bar, enabling
you to toggle between calculation types for the filtered data.
The calculation icon only appears
when a filter is applied to a report with calculations.
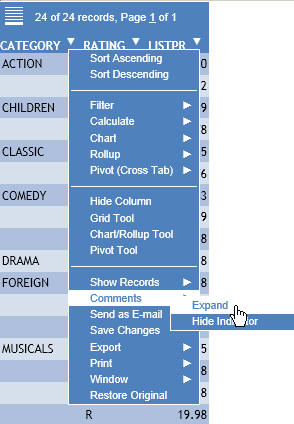
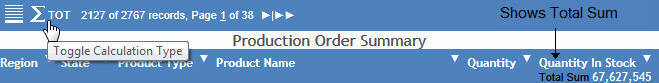
Click
the calculation icon on the pagination bar to toggle between calculations
for the filtered data. Note that the column total value changes
accordingly, as shown in the following images.
xFiltering, Highlighting, and Commenting Individual Rows of Data
In addition to using column controls to filter and highlight
your report, you can also filter, highlight, and comment individual
rows of data in the active report output.
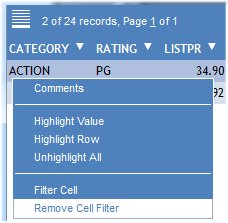
When a row is selected, the context menu offers options to add
comments, highlight values and rows, and filter cells.
For example, the following image shows
the context menu for a row in the active report output.
x
Procedure: How to Add Comments to a Row in the Active Technologies Report Output
You
can add multiple comments per row. Comments cannot be edited but
they can be deleted.
-
Select the
row of data that you want to add a comment for, click and select Comments from
the context menu.
The Add Comment dialog box opens.
-
Type in a comment in the Enter Comment field.
-
Click Add
Comment to add the entry and close the dialog box.
A comment  icon
indicates that there is a comment in the row.
icon
indicates that there is a comment in the row.
If you are using WebFOCUS theme and
style files that are packaged with the product, an earlier version
of the comment indicator [*] may be displayed, as shown in the following
image.
-
To view existing comments:
Comments cannot be edited.
-
To delete
an existing comment:
x
Procedure: How to Highlight Values and Rows in the Active Technologies Report
Output
To highlight
a row:
Select
the row of data that you want to highlight, and click and select Highlight
Row from the context menu.
The row is highlighted
in yellow.
You
can highlight multiple rows.
To highlight a value:
Select
the row of data that you want to highlight, and click and select Highlight
Value from the context menu.
The row is highlighted
in an aqua color.
Highlight Value is only applicable for one
row. When you apply Highlight Value, any other highlighted rows
are unhighlighted.
You can use the context menu to highlight
other rows, unhighlight the row, or unhighlight all rows.
x
Procedure: How to Filter a Row in the Active Technologies Report Output
The
filter option enables you to filter the output and only show a selected
row of data.
-
Select the
row of data that you want to filter, and click and select Filter
Cell from the context menu.
The output refreshes and only shows the filtered row of data.
-
Select Remove
Cell Filter from the context menu to remove the filter
and return to the original output results.