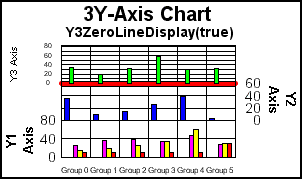
This property enables or disables drawing of the zero line on the Y3-axis when zero is within the Y3 axis scale range.
Syntax:
setY3ZeroLineDisplay(boolean);boolean = getY3ZeroLineDisplay();where:
Can be one of the following:
true draws zero line on Y3-axis.
false does not draw zero line. This value is the default.
Example:
setDepthAngle(0);
setDepthRadius(0);
setFootnoteDisplay(false);
setAxisAssignment(getSeries(0), 1);
setAxisAssignment(getSeries(1), 2);
setGraphType(103);
setTitleString("3Y-Axis Chart");
setY1TitleString("Y1 Axis");
setY2TitleString("Y2 Axis");
setTextString(getY3Title(), "Y3 Axis");  setY3ZeroLineDisplay(true);
setLineWidth(getY3ZeroLine(), 5);
setFillColor(getY3ZeroLine(), new Color(255,0,0));
setSubtitleString("Y3ZeroLineDisplay(true)");
Note: To increase the width of the zero line, use the getY3ZeroLine() method to get the object ID of the line and the setLineWidth() method to specify the width of the line (in pixels).
| WebFOCUS |