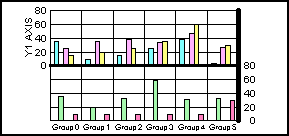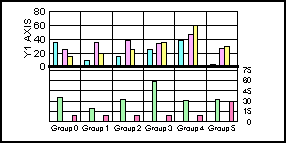
This property enables or disables display of the Y2 axis base line. The Y2AxisSide property determines the location where the Y2 axis base line is drawn.
Syntax:
setY2AxisLineDisplay(boolean);boolean = getY2AxisLineDisplay();where:
Can be one of the following:
true draws the Y2-axis base line. This value is the default.
false does not draw the Y2-axis base line.
Example:
setDepthAngle(0);
setDepthRadius(0);
setGraphType(21);
   setY2AxisLineDisplay(true);
setLineWidth(getY2AxisLine(),8);
setY2AxisLineDisplay(false);
Note: In the default configuration for this graph type, the Y2AxisLine is the same width and location as the bottom of the graph frame. When this line size is used, the setting of this property does not change the appearance of the graph. To make a thicker and more visible axis line, use the getY2AxisLine() method to get the object ID of the line and setLineWidth() method to increase the width of the line.
See Y2AxisSide, setLineWidth(), getAxisAssignment(), setAxisAssignment(), getAxisSide(), setAxisSide().
| WebFOCUS |