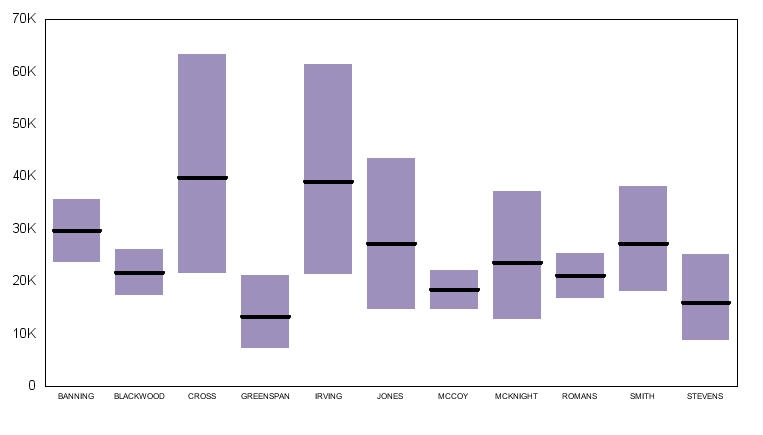
When the GraphType property is set to 124 (Box Plot) or 130 (Horizontal Box Plot), this property sets the graph to be displayed as either a box, or whisker graph.
Syntax:
setBoxPlotType(value)where:
Can be one of the following:
0 for a box graph. This is the default value.
1 for a whisker graph.
Example:
setGraphType(124); setBoxPlotType(o);
setBoxPlotType(1);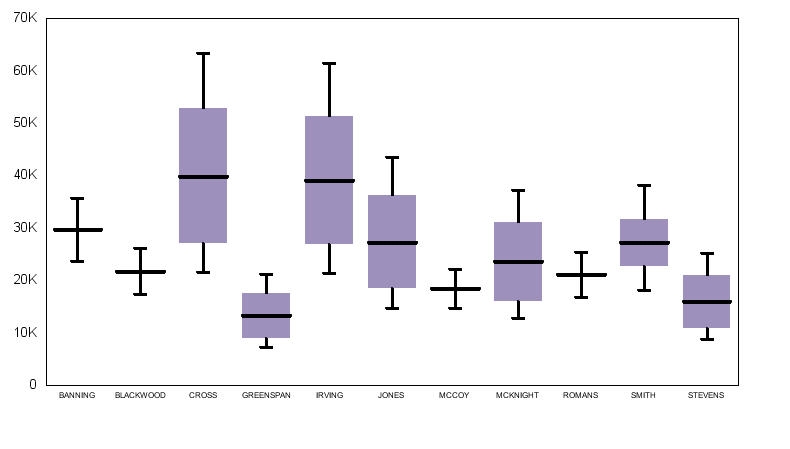
setGraphType (130);
   setBoxPlotType(0);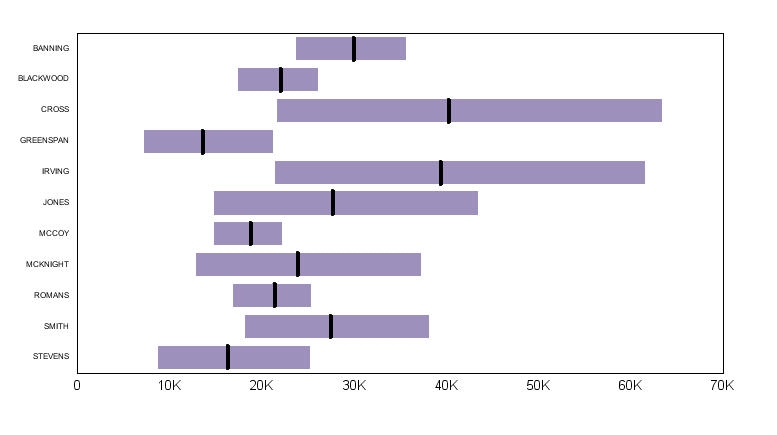
setBoxPlotType(1);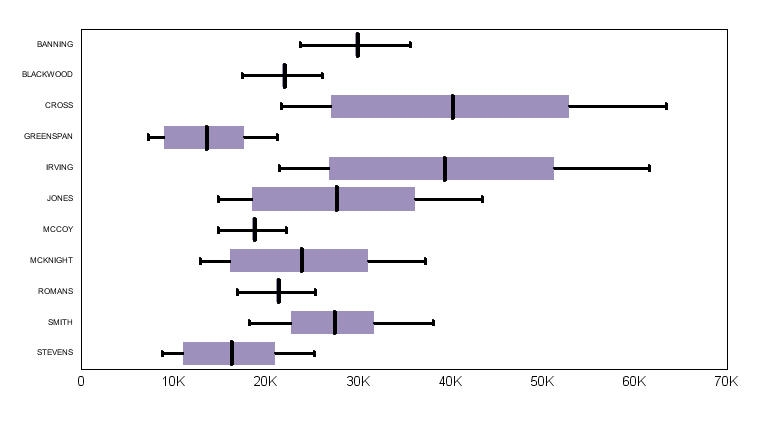
| WebFOCUS |