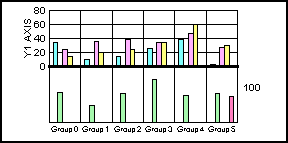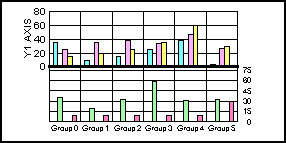
This property selects logarithmic or linear scaling for the Y2-axis. When the scale range is set to automatic, any data items with Y2 values less than or equal to zero are graphed as null for log scale. If a manual scale range is specified to include negative values (Y2ScaleMin less than or equal to zero), the request for log scale is ignored and Y2LogScale is automatically set to false (linear scale).
Syntax:
setY2LogScale(boolean)boolean = getY2LogScale();where:
Can be one of the following:
true uses logarithmic scale.
false uses linear scale. This value is the default.
Example:
setGraphType(21);
   setY2LogScale(true);
setDepthAngle(0);
setLegendDisplay(false);
setDepthRadius(0);
setY2LogScale(false);
See getLogScale(), setLogScale().
| WebFOCUS |