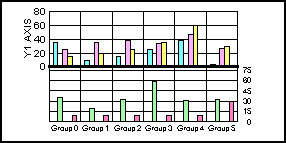
This property enables or disables exclusion of the minimum label on the Y2 axis. For example, if the Y2-axis labels include values in the range 0, 15, 30, 45, 60, 75 and this property is set to true, the new set of Y2-axis labels will include 15, 30, 45, 60, 75.
Syntax:
setY2ExcludeMinLabel(boolean);boolean = getY2ExcludeMinLabel();where:
Can be one of the following:
true excludes minimum label.
false includes minimum label. This value is the default.
Example:
setDepthAngle(0);
setDepthRadius(0);
setLegendDisplay(false);
setGraphType(21);
   setY2ExcludeMinLabel(false);
setY2ExcludeMinLabel(true);
Note: This property will not affect the appearance of the graph if drawing of Y2-axis labels has been disabled with setY2LabelDisplay(false); When setY2LabelDisplay(true) is used, the minimum label will be included or excluded as defined by Y2ExcludeMinLabel.
See Y2ExcludeMaxLabel, Y2LabelDisplay, getExcludeMaxLabel(), getExcludeMinLabel(), setExcludeMaxLabel(), setExcludeMinLabel().
| WebFOCUS |