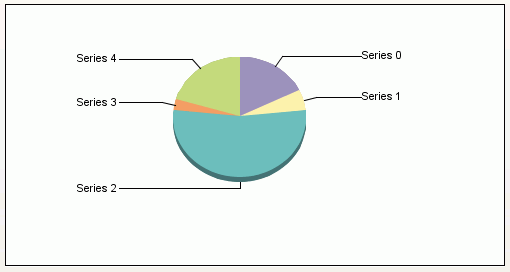
This property determines the format of labels displayed next to feelers in a pie graph. The GraphType property must be set to one of the pie graphs (55...60).
Syntax:
setPieLabelDisplay(value);value = getPieLabelDisplay();where:
Can be one of the following:
0 for the absolute (true) value of the slice.
1 for the percent value of the slice. 1 is the default value.
2 for the series label.
3 for the series label and percent value.
4 for the series label and absolute value.
5 for the absolute value and percent value.
6 for the absolute value, percent value, and series label.
Example:
setGraphType(55);
   setPieLabelDisplay(2);
setPieLabelDisplay(3);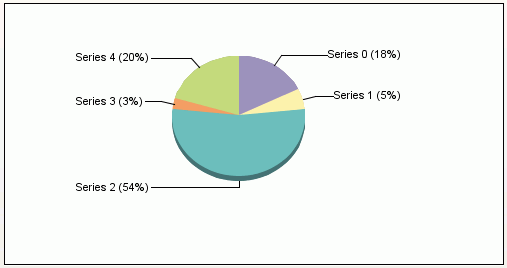
setPieLabelDisplay(4);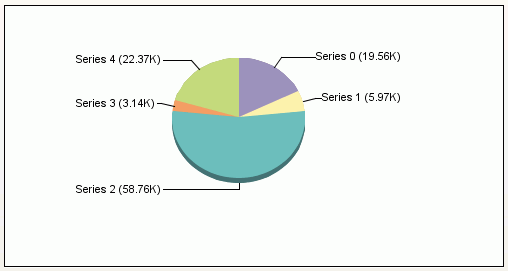
setPieLabelDisplay(5);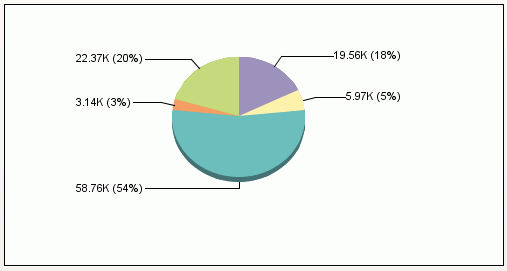
setPieLabelDisplay(6);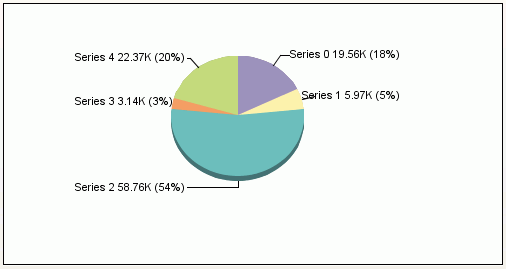
Note: For values 5 and 6, use objects getPieSliceFeelerValue() and getPieSliceFeelerPercent().
See PieFeelerTextDisplay, PieFeelerTextFormat, PieFeelerTextFormatPattern, getPieSliceFeelerValue(), getPieSliceFeelerPercent().
| WebFOCUS |