This property controls which side of the graph the primary ordinal (O1) axis is imaged. It also determines where axis labels are drawn when the O1LabelDisplay property is set to true. The primary ordinal axis is typically imaged at the bottom of the graph in vertical graphs and on the left side in horizontal graphs.
Syntax:
setO1AxisSide(value);value = getO1AxisSide();where:
Can be one of the following:
0 for Vertical: Bottom or Horizontal: Left. 0 is the default value.
1 for Vertical: Top or Horizontal: Right
2 for Vertical: Top and Bottom or Horizontal: Right and Left
Example:
setDepthRadius(0);
setY1MajorGridDisplay(false);
setY1AxisLineDisplay(false);
setO1MajorGridDisplay(false);
setFrameDisplay(false);
   setO1AxisSide(1);
setO1AxisSide(2);
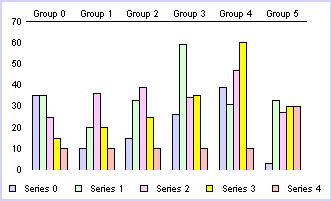
setDepthRadius(0);
setGraphType(24);
setY1MajorGridDisplay(false);
setY1AxisLineDisplay(false);
setO1MajorGridDisplay(false);
setFrameDisplay(false);
setO1AxisSide(0);
setO1AxisSide(1);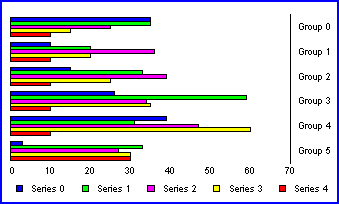
setO1AxisSide(2);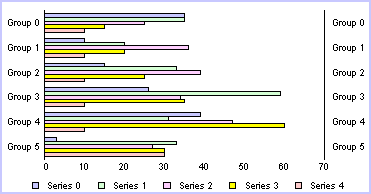
See O1AxisLineDisplay, getAxisSide(), setAxisSide().
| WebFOCUS |