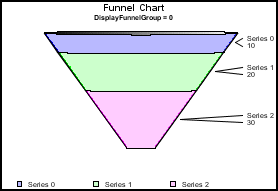
In a Funnel Graph (GraphType = 106), the value of this property defines the group to be drawn in the graph. Funnel graphs are similar to pie graphs except they show only a single group. The series in the selected group are stacked from top to bottom in the funnel.
Syntax:
setDisplayFunnelGroup(value);value = getDisplayFunnelGroup();where:
Is an integer value between 0 and the number of groups in the data set. 0 is the default value.
Example:
setData(0,0,10);
setData(1,0,20);
setData(2,0,30);
setSeriesLabel(0, "Series 0");
setSeriesLabel(1, "Series 1");
setSeriesLabel(2, "Series 2");
   setDisplayFunnelGroup(0);
setDataRangeToExtent();
setGraphType(106);
setTitleString("Funnel Chart");
setSubtitleString("DisplayFunnelGroup = 0");
setTransparentBorderColor(getFrame(), true);
See FunnelLabelValueLocation, PieDepth, PieRotate, PieTilt.
| WebFOCUS |