Note: Be careful that you do not click on any data in the chart because then you will be selecting data instead of selecting the chart window. Once the chart window is highlighted with the grey border use the CTRL C function on your keyboard to copy the chart. You can now paste the chart into a new document.
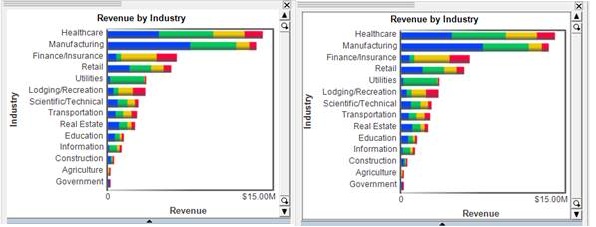
Unselected chart Selected chart with grey border
If your Task View isn’t displayed on the left side of your dashboard, open it using the top View menu and selecting Task View. On the Task View, under “Step 4: Sharing Results”, you have the option to Export Current Page. Clicking on this link will export whatever page is currently open in your dashboard. The link opens a wizard, as shown in the following image, which will ask you to choose a title for the page that you’re exporting (the default title is the page name in the dashboard). Next, choose the file format that you want to export the page to. Under Options, decide whether or not you want to include the color legend. Use the Description window to write notes about the page that you’re exporting. These notes will be displayed in the final file however they can still be modified in the exported file. Then save and open your new file.