Export Data:
You can export data directly from Data Sheets or Summary Sheets on dashboard pages. If you have filtered and excluded data from your dashboard then you will be exporting the subset of data that is currently selected.
Note: Only the columns shown in the data sheet or summary sheet are exported. If you want to export additional columns, then they should be added to the chart. If you want the columns to export but do not necessarily want to see those additional columns in the dashboard, place them over to the right and shrink the column width so that you do not see them.
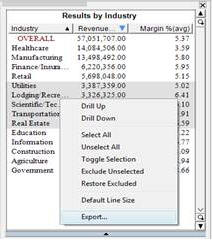
To export data from a dashboard page, right-click on the Data Sheet or Summary Sheet that you want to export and select Export from the popup menu. The data will be exported into a CSV file with a link that will open it in Excel.
Copy Charts and Pages
You can copy charts directly from the dashboard pages as they show on the screen. There are three ways to do this:
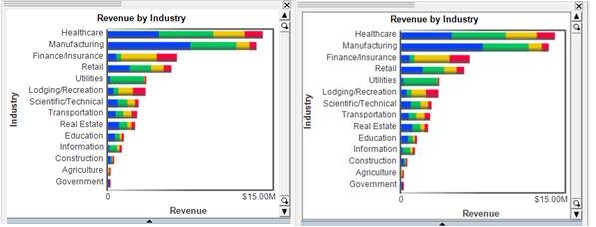
Unselected chart Selected chart with grey border
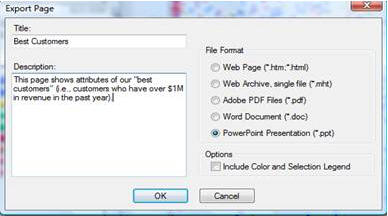
If your Task View isn’t displayed on the left side of your dashboard, open it using the top View menu and selecting Task View. On the Task View, under Step 4: Sharing Results, you have the option to Export Current Page. Clicking on this link will export whatever page is currently open in your dashboard. The link opens a wizard, as shown in the following image, which will ask you to choose a title for the page that you’re exporting (the default title is the page name in the dashboard). Next, choose the file format that you want to export the page to. Under Options, decide whether or not you want to include the color legend. Use the Description window to write notes about the page that you’re exporting. These notes will be displayed in the final file however they can still be modified in the exported file. Then save and open your new file.
Saving a WebFOCUS Visual Discovery Project:
You can save your work in a project in one of two formats:
To save a project:
Automating project refresh and save:
Also, WebFOCUS Visual Discovery ships with an adv2advm utility which will open an .adv project file in order to reload data from the data source(s), and then covert that file to an .advm for end-user viewing and interaction. This utility can be embedded in a short script so that a project can be refreshed periodically, say daily, with the end result being an .advm file. An .advm file will open faster, not impact the data sources, and consume less RAM than the same project in an .adv file format.
| WebFOCUS |