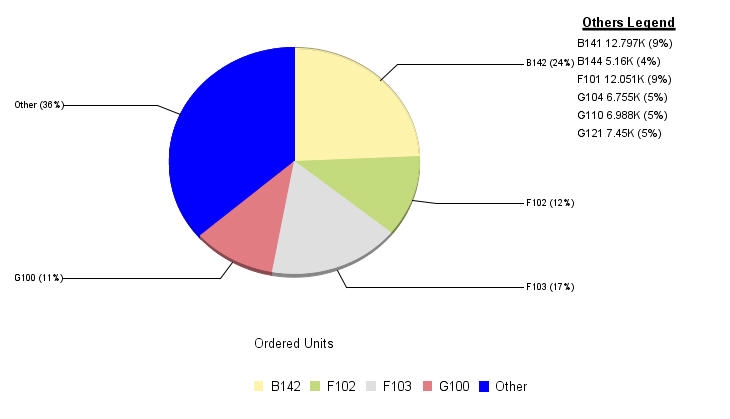
This property controls whether or not the Other Series is shown on the chart. When enabled, pie slices with the values that are equal to or less than what is defined in Other Percentage property (default is 0.5 percent) are grouped into one slice, called "Other" and can be displayed in the "Other" Legend. When disabled, all slices are drawn on the pie chart.
Syntax:
setOtherSeries(boolean);boolean = getOtherSeries();where:
Can be one of the following:
true draws slices less than or equal to OtherPercentage together as an "Other" slice.
false draws all slices individually.
Example:
setGraphType(55);  setOtherSeries(true);
setOtherPercentage(10.0);
setDisplay(getPieOtherFrame(),true);
setFontSizeAbsolute(getPieOtherLabel(), true);
setFontSizeInPoints(getPieOtherLabel(), 8);
setPlaceResize(getPieOtherLabel(), 0);
setFillColor(getSeries(-1),new Color(0,0,255));
setBorderColor(getSeries(-1),new Color(0,0,255));
setPieLabelDisplay(3);
See OtherPercentage.
| WebFOCUS |