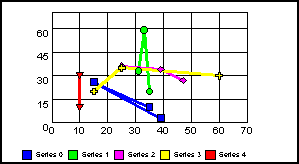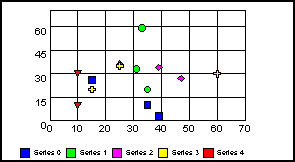
This property enables or disables the display of connecting lines between markers in a scatter graph. The color of each line matches the color of the series marker. You can use the MarkerSizeDefault property to set the size of the markers.
Syntax:
setConnectScatterMarkers(boolean);boolean = getConnectScatterMarkers();where:
Can be one of the following:
true draws a line connecting all markers in the same series, in the order the points are in the data matrix.
false does not draw connecting lines. This value is the default.
Example:
setMarkerSizeDefault(60);
setGraphType(61);  setConnectScatterMarkers(true);
setConnectScatterMarkers(false);
Note: A scatter graph must be selected with the GraphType property.
See ConnectLineMarkers, MarkerSizeDefault.
| WebFOCUS |