Resource Analyzer offers tabular and graphical reports which show content planning requirements, user activity profiles, usage profiles over time, typical request structures, and columns used. These reports are accessed from the Web Console of the server. For more information on each individual report, see Resource Analyzer Report Options.
Note: On MVS, only data that has been archived to the repository is available for reporting.
Usage Analysis Reports comprise three categories of analysis:
Resource Analyzer reports are initially displayed in tabular format. Reports can also be reformatted as EXCEL, PDF, PowerPoint and, if available, active reports. For information, see Alternate Reporting Output.
You can also re-sort reports by different columns and drill-down on various hyperlinks to view more detailed information and different reports.
You can specify date-range selection criteria for the reports by accessing a calendar through the Date drop-down list.
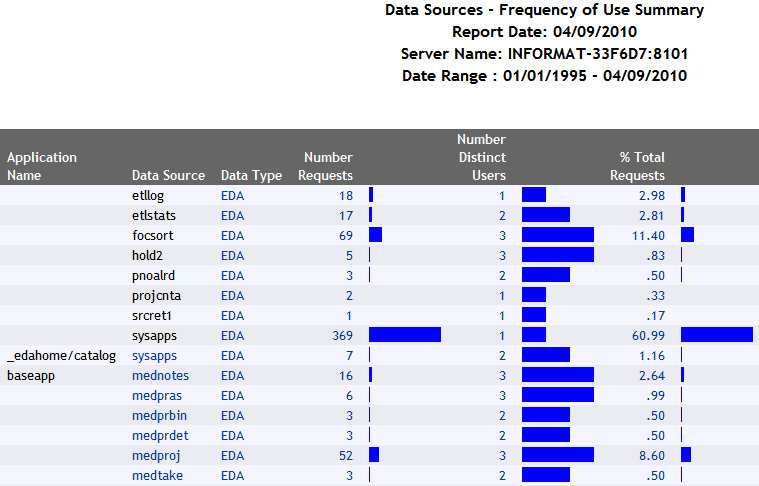
Reports are viewed using Data Visualization. Data Visualization provides a means for you to add visual representations of data to your report output. In Resource Analyzer, these visual representations are in the form of horizontal bar graphs. These graphs make relationships and trends among data more obvious.
The following image shows an example of report output using Data Visualization.
For more information on running and viewing these reports and graphs, see Resource Analyzer Report Options.
| WebFOCUS |