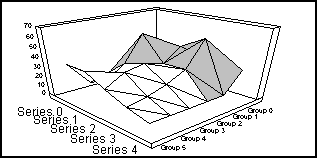
When a graph is colored by height (rather than by series or by group), the graphing engine chooses the color of quantitative data representations based on the data values supplied to the graph. This happens in spectral map graphs and in three-dimensional surface graphs. If, for example, the data ranges from 7 to 74 and the Y1-axis scale, therefore, ranges from 0 to 80, the graphing engine might assign the colors blue to zero, red to 80, and various interpolated shades for values between zero and 80.
Note: Spectral Map graphs include a Y1-axis even though it is not visible in the graph.
The getColorByHeight() method returns the IdentObj of the color by height gradient (in this case a blue to red one). With the object ID, your application can modify the gradient. Its end colors can be changed or the gradient could be made more complex. For example, in a spectral map of some topography, you could specify that the first half of the gradient representing ocean depths from -20,000 feet to zero go from dark blue to light blue. The second half of the gradient might show land heights from zero to 20,000 feet and could be represented by a gradient from green to brown.
Syntax:
IdentObj getColorByHeight();
Example:
setGraphType(12);
setGradientNumPins(getColorByHeight(),4);
setGradientPinLeftColor(
    getColorByHeight(),new Color(255,0,0),1);
setGradientPinPosition(getColorByHeight(),0.0,0);
setGradientPinPosition(getColorByHeight(),1.0,1);
setGradientPinRightColor(
    getColorByHeight(),new Color(0,0,255),0);

See setGradientNumPins(), setGradientPinLeftColor(), setGradientPinPosition(), setGradientPinRightColor(), ExactColorByHeight.
| WebFOCUS |