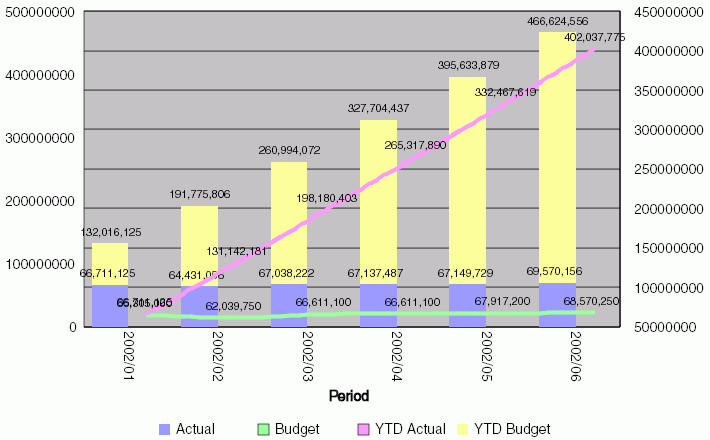
This property allows creating a graph with stacked and non-stacked risers. This type of graph is useful when showing cumulative sales of several products in monetary units along with sales volume and return volume. It is also useful for financial ratios, statistical information (such as standard deviations), or control limits.
Syntax:
setForceSeriesAbsolute(getSeries(id), boolean);
where:
Is the object ID of the Y-Axis field.
Using a Stacked chart type will cumulate all the fields, therefore this setting has to be added manually and set to true for each field that should be non-stacked.
Can be one of the following:
true enables stacked and non-stacked charts.
false disables stacked and non-stacked charts. This is the default value.
Example
The following code shows how to use stacked and non-stacked charts in the same graph. The relevant code is shown in bold. Note the numbers at each data point. The bars are plotted on the Y-axis on the left, and the lines are plotted on the Y-axis on the right for clarity.
setForceSeriesAbsolute(getSeries(1),true); setForceSeriesAbsolute(getSeries(2),true); setForceSeriesAbsolute(getSeries(3),false);The output is:

| WebFOCUS |