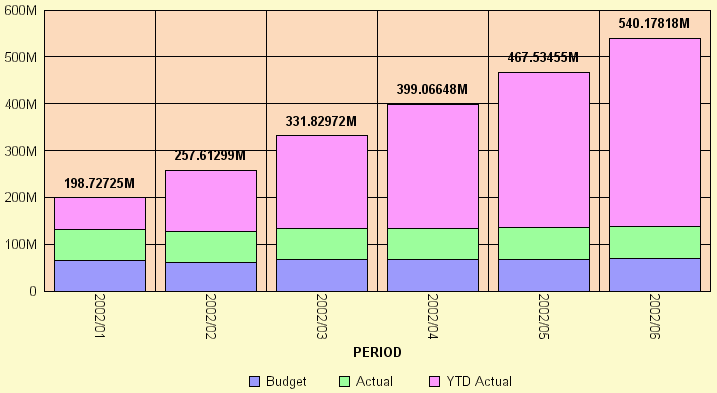
This property controls the display of cumulative values on top of the stacked riser. This is different from regular Data Text Display on Stacked charts where cumulative totals appear on each segment of the riser. This option is available for bar, line, and area stacked charts.
Syntax:
setDisplay(getDataTextStackedTotalOnTop(), boolean);where:
Is true or false. When boolean is true, cumulative values appear on the risers in the graph output. When it is false, cumulative values do not appear.
Note: The position of StackedTotal data text is on the bottom of the stack when the sum is negative and on the top of the stack when the sum is positive.
Example:
The following example illustrates a stacked bar chart where cumulative values appear on the risers.
GRAPH FILE CENTSTMT
SUM CENTSTMT.CONSOL.BUDGET_AMT
CENTSTMT.CONSOL.ACTUAL_AMT
CENTSTMT.CONSOL.ACTUAL_YTD
ACROSS CENTSTMT.CONSOL.PERIOD
ON GRAPH SET LOOKGRAPH VBRSTK1
ON GRAPH SET 3D OFF
ON GRAPH SET GRID ON
ON GRAPH SET GRAPHEDIT SERVER
ON GRAPH SET VZERO ON
ON GRAPH SET GRAPHSTYLE *
setFillColor(getFrame(),new Color(255,218,185));  setDisplay(getDataTextStackedTotalOnTop(), true);
setPlace(true);
ENDSTYLE
ON GRAPH SET STYLE *
TYPE=REPORT,BACKCOLOR=rgb(255 250 205),  $
ENDSTYLE
END
The output is:

| WebFOCUS |