Log Reports

In this section:

How to:

Reference:

Log reports are stylized HTML format and appear in a separate browser window. You can search, print, or save the log report. The log report displays information according to your specifications in a separate browser window. One log record is produced for each scheduled job run in the specified time frame.


Top of page

x
Tracking Schedules in the Console

In this section:

Reference:

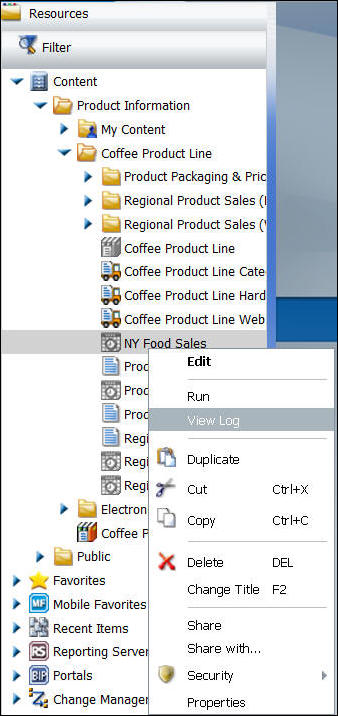
Information about a schedule, such as date, time, execution status, and recipients of a distributed job, can be accessed by running a log report and checking the job status. For more information, see ReportCaster Console .


x
Using Schedule Logs

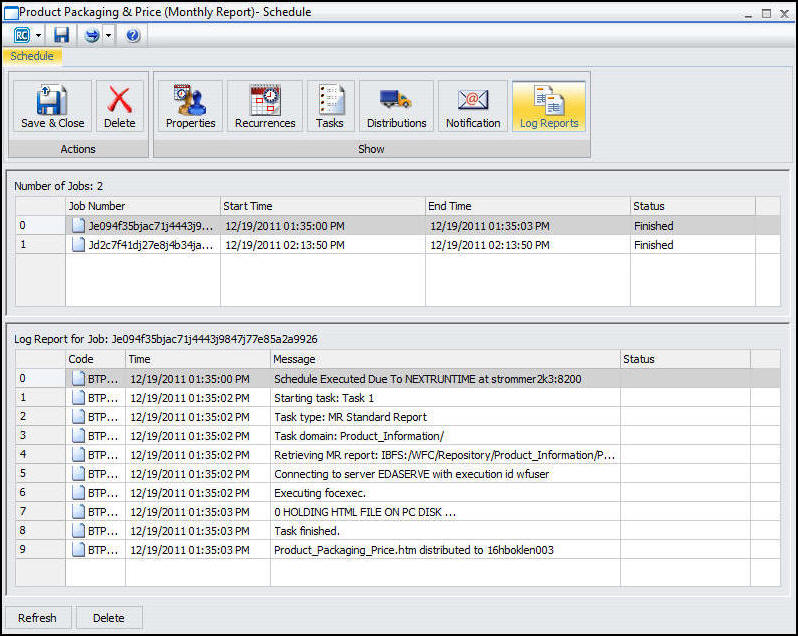
Log reports enable you to view information about a distributed job, such as whether or not the job executed successfully, when the scheduled output was distributed, in what format the distributed output was sent, and the method of distribution. Log reports are stylized HTML format and display in a separate browser window. You can search, print, or save the log report.

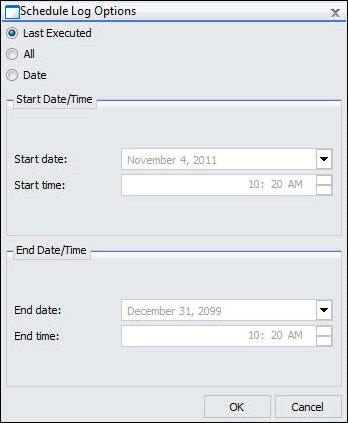
The log file accumulates information. You should periodically purge log records to manage the number of log reports stored in the Repository, as well as the performance of log report information that is displayed.

The list in the right panel provides basic information about the job execution, including the job ID, the time the job started running, the amount of time it took to complete the execution of the job, and the general status of the job. To view a full log report for a job, double-click the job in the job list.


x
Reference: &ECHO and -TYPE Support in Log Reports

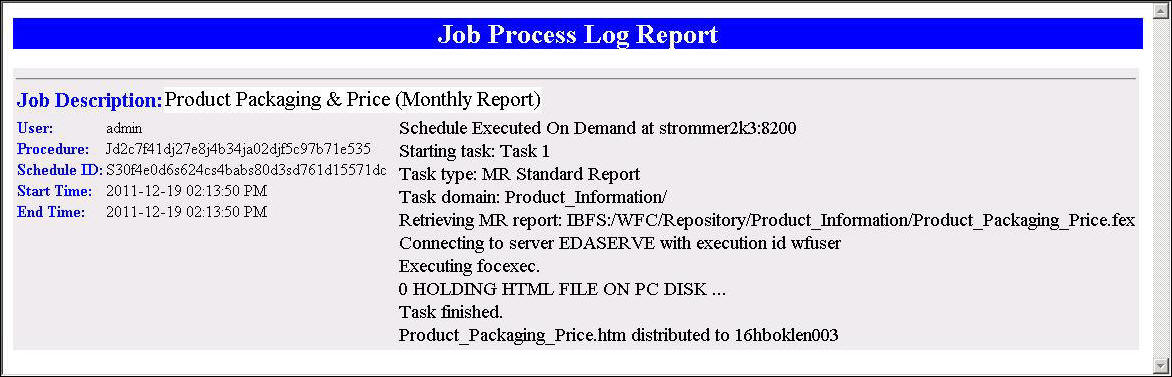
Values from &ECHO variables and -TYPE commands in procedures appear in log reports. The &ECHO variable displays command lines as they execute in order to test and debug procedures. The -TYPE command enables you to comment and evaluate your code for informational and debugging purposes. For example, if the following procedure is scheduled using ReportCaster, it may produce a log report similar to the example that follows this procedure.

Note: The second -TYPE is on a single line within the report procedure (FEX).

-SET &ECHO='ALL';
-TYPE Regional Product Sales Forecast
-TYPE Parameter RATE is passed into report to forecast potential sales growth
-DEFAULT &RATE = .05;
-DEFAULTH &WF_TITLE='WebFOCUS Report';
TABLE FILE GGSALES
SUM DOLLARS
COMPUTE GROWTH/D12.2= (DOLLARS * &RATE) + DOLLARS; AS 'Sales, Forecast'
BY REGION
BY PRODUCT
ON TABLE PCHOLD FORMAT HTML
ON TABLE NOTOTAL
ON TABLE SET PAGE-NUM NOLEAD
ON TABLE SET SQUEEZE ON
ON TABLE SET EMPTYREPORT ON
ON TABLE SET HTMLCSS ON
ON TABLE SET HTMLENCODE ON
ON TABLE SET STYLE *
TYPE=REPORT, TITLETEXT=&WF_TITLE.QUOTEDSTRING,$
ENDSTYLE
END

The following image shows an example of the log report.

Job Process Log Report

Note: For more information about &ECHO variables, see Testing and Debugging a Dialogue Manager Procedure in the Developing Reporting Applications manual.


Top of page

x
Checking the Schedule Status

Another resource for tracking schedules is the schedule job status. The schedule status provides a list of scheduled jobs that are in the Distribution Server queue. Status information includes the schedule ID, the time it started running, and the status of the job.

To access the schedule status information, click the Log Reports tab, as shown in the following image.

For more information about job status, see Job Status.


Top of page

x
Procedure: How to View a Log Report From the Tree
  1. Right-click the schedule from the tree and select View Log, as shown in the following image.

    resource tree

    The Schedule Log Options dialog box appears, as shown in the following image.

    schedule log options

  2. Specify which log report you would like to view by selecting Last Executed, All, or Date.

    If you select Date, you will have the option to specify your search using start date and time and end date and time parameters.

  3. Click OK.

    The log reports that match your search criteria appear, as shown in the following image.

    The log report first lists the job description for the record, which is the unique description identifier that you specified when you created the schedule. Underneath the Job Description, the left column of the log report includes the following information:

    • User. ReportCaster user ID, indicating the owner of the schedule.
    • Procedure. Unique key generated by ReportCaster that identifies a specific execution of a scheduled job.
    • Schedule ID. Unique key generated by ReportCaster that was assigned to the job when it was scheduled.
    • Start Time. Date and time the job started running.
    • End Time. Date and time the job finished running.

    In the second column, the log report specifies messages consisting of the following:

    • General information, such as the method of distribution for a particular job (for example, email distribution).
    • Processing information, indicating that the request started, distribution was successful, and the request was completed. Processing information also includes reasons why a request failed, such as the unavailability of a data source.

Top of page

x
Procedure: How to View a Log Report in the Scheduling Tool
  1. From the Basic Scheduling tool, click the Log Reports tab.

    The Log Reports panel appears, as shown in the following image.

  2. Observe the Number of Jobs that have run.
  3. Click the Job Number to view the log report information for that job in the panel below the job listing.

Top of page

x
Reference: Considerations When Viewing a Log Report

When viewing a log report, be aware of the following considerations.

Task and Report Names

The ReportCaster Log references WebFOCUS folders and procedures (FEXs) by their path and file names and not their descriptions.

Email Addresses

ReportCaster cannot validate email addresses since email validation is performed by the mail server. The log report will include any email addresses validated by the mail server and returned to ReportCaster.

Burst Reports

Unavailable Options


WebFOCUS