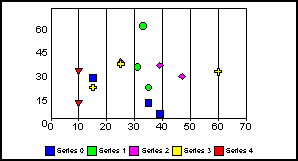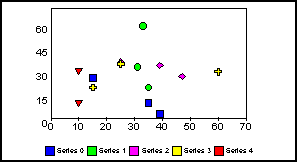
This property controls the appearance of major grid lines on the numeric X-axis of a graph. Grid lines can be small ticks at the base of the axis line or lines that extend to the height of the graph frame. Major grid lines are normally set to a different style than minor grid lines so that the user can distinguish between the two.
Syntax:
setX1MajorGridStyle(value);value = getX1MajorGridStyle();where:
Can be one of the following:
0 for normal grid lines, height of frame. 0 is the default value.
1 for normal grid lines extend beyond the height of frame.
2 for small tick marks from frame edge inward.
3 for small tick marks from frame edge outward.
4 for small tick marks span across the frame edge.
Example:
setY1MajorGridDisplay(false);  setX1MajorGridStyle(1);
setGraphType(61);
setX1MajorGridStyle(4);
See X1MajorGridDisplay, X1MinorGridDisplay, X1MinorGridStyle, getGridStyle(), setGridStyle().
| WebFOCUS |