The Test tab allows you to do
hypothesis testing and correlation analysis. RStat supports two
types of statistical inferences, estimation and hypothesis testing.
-
Estimation. Also
referred to as predictive modeling, is the process of deriving expected
and predicted values from observations. Decision trees, regression,
and the other algorithms on the Model tab are used to generate estimates. For
example, you can estimate whether a prospect is a good target for
a particular marketing campaign or you can estimate the expected
sales revenues for different stores in order to determine whether
store layout and product mix has impact on sales.
-
Hypothesis Testing. Gives
you a way of using samples to test whether or not statistical claims
are likely to be true. For example, drug A is more effective than drug
B, male customers spend less than female customers, the response
rate to offer A is better than that of offer B, machine A produces
more defects than machine B, individual expense reports from the
southern region are greater than those from the western region,
and so on.
Use Case for Hypothesis Testing
Analysts may want to determine if a marketing campaign is successful.
They design a test group, which receives an offer, and a control
group, which does not. The spending of both groups is tracked in
the database. The hypothesis test will determine if the two groups differ
significantly in their spending patterns.
Why test? In this example, analysts want to find out if the test
group spends more. If the test group spends the same as the control
group, they will assume that the campaign is not successful. Rarely
are the expenditures of the two groups identical, so the question arises,
how different must the expenditures be in order to determine if
the campaign has an effect? The test statistics indicate whether
the differences are statistically significant.
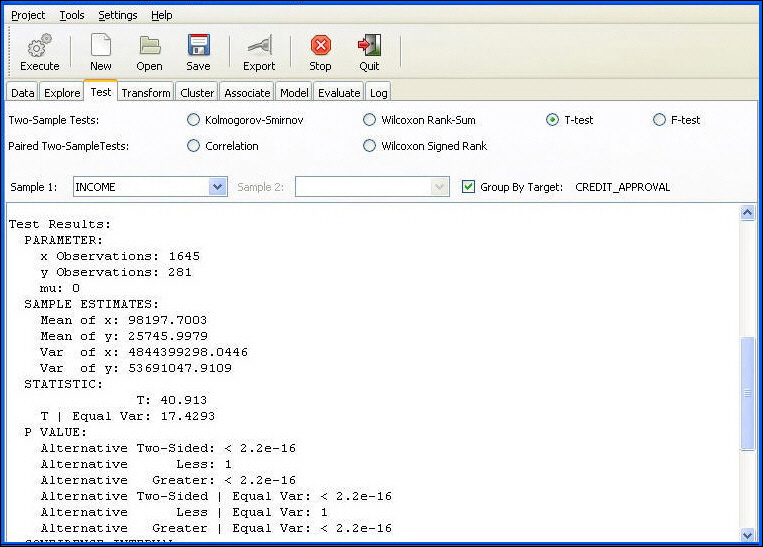
An image of the Test tab follows. Samples for testing can be
selected in one of two ways.
Note: The drop-down boxes can contain only numeric variables.
The following image shows an example of using a T-test to identify
two samples, people with good credit and people with bad credit,
and whether their income differs significantly between the two groups.
The types of tests included are:
Parametric Test. These
tests make strong assumptions that the underlying distribution is
normal, for example, having a bell-shaped curve.
-
T-test. Is
the most commonly used test to determine whether the means of two
normally distributed samples are of equal sizes. The mean is a measure of
the location of the distribution. If the two populations are normal
(bell shaped) and their means are different, then the two bell shapes
will be offset from one another, indicating that the two samples
are different. If the means are equal, the bell shapes will overlap.
-
F-test. Is
used to determine if the standard deviations of two samples are
the same. If the standard deviations are not the same, the bell-shaped
curves will be different for the two samples. If the samples have
the same standard deviations, then a T-test can be conducted to
test if the means are equal. The test is also referred to as a test
on the variance of two samples and is used in analysis of variance (ANOVA).
Non-Parametric Test. These tests make no assumptions that
the underlying distribution is normal. They are suitable for many
types of data that do not follow the normal distribution, for example,
ranked and cross-tabulated data.
-
Kolmogorov-Smirnov. The
test compares the two distributions by being sensitive to both the
location (mean, median, mode) and the shape (spread) of the distribution.
-
Wilcoxon Rank-Sum. This
test, also known as the Mann-Whitney-Wilcoxon test, is analogous
to the two-sample T-test, but is performed on the rankings of the
combined data sets instead of on the actual measure. If the observation
rankings are not different, then the samples are not different.
Because it is performed on the rankings, it is more sensitive about
the location of the distribution, that is, to the median (not the
mean as in the T-test).
-
Wilcoxon Signed Rank. This
test differs from all the above because it is used on two related
samples, such as matched pairs, before and after tests, and repeated
measurements on the same individuals.
Correlation Analysis. Determines if there is a linear
relationship between two variables. It also measures the strength
and direction of the relationship. Correlation analysis does not
test whether two samples are different.
-
Correlation Test. Tests
for the existence of a linear relationship between the two variables.
Only the Pearson correlation test is performed in the Test tab.