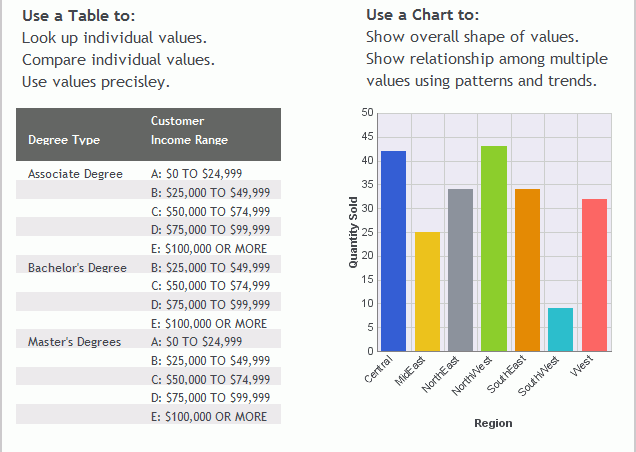
A chart often conveys meaning more clearly and effectively than data displayed in tabular form. A chart enables you to visually communicate quantitative information. On a chart, you can give data a shape and form, and reveal patterns and relationships among many data values. A chart can highlight anomalies that require further investigation. These are some things to consider when deciding between a report and a chart for your data.

| WebFOCUS |