

area
area3d
bar
bar3d
This JSON property defines the chart type. However, it is recommended that you use the WebFOCUS LOOKGRAPH parameter to establish the chart type, when a corresponding LOOKGRAPH value exists. For information about the LOOKGRAPH parameter, see Controlling Chart Type Using LOOKGRAPH.
chartType: 'string'where:
Is a string enclosed in single quotation marks (') that defines the chart type. The default value is 'bar'.
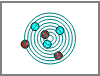
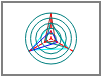
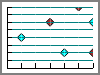
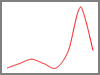
The valid chartType values, with illustrations of each chart type follow:
|
|
|
|
area | area3d | bar | bar3d |
|
|
|
|
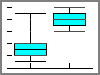
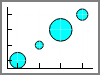
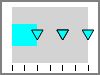
boxplot | bubble | bubblemap | bullet |
|
|
|
|
choropleth | funnel | gauge | heatmap |
|
|
|
|
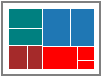
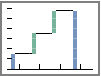
histogram | line | mekko | parabox |
|
|
|
|
pareto | pie | polar | radar |
|
|
|
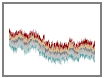
scatter | sparkline | streamgraph |
|
|
|
|
surface3d | tagcloud | treemap | waterfall |
| WebFOCUS |